Format Presets
Named format presets let you control how axis tick labels and legend labels display values without memorizing d3-format strings or strftime patterns. Presets resolve to format strings in Python before the chart spec reaches the Rust renderer.
Use label_format in AxisConfig (or in .configure_axis()) for named presets, and
label_format_raw when you need a format the presets don't cover.
import ferrum as fm

# Named preset
chart.configure_axis(label_format="currency")

# Raw d3-format string
chart.configure_axis(label_format_raw="$,.2f")
label_format and label_format_raw are mutually exclusive. Providing both raises
ValueError at construction time.
Numeric presets
These presets apply to quantitative (Q) axes.
| Preset | d3-format | Example output | When to use |
|---|---|---|---|
"integer" |
,.0f |
1,234 | Counts, whole-number values |
"decimal" |
,.2f |
1,234.56 | General floating-point |
"decimal1" |
,.1f |
1,234.6 | One decimal, with thousands separator |
"percent" |
.1% |
45.2% | Rates, proportions (0–1 input) |
"percent_int" |
.0% |
45% | Rounded percentages |
"si" |
.2s |
1.2k | Large numbers, abbreviated |
"currency" |
$,.0f |
$1,234 | Dollar amounts, no cents |
"currency_cents" |
$,.2f |
$1,234.56 | Dollar amounts with cents |
"compact" |
.2~s |
1.2k | Like "si" but trailing zeros suppressed |
"scientific" |
.2e |
1.23e+3 | Scientific/engineering notation |
"ordinal" |
(Rust-side) | 1st, 2nd, 3rd | Rankings, ordered labels |
Notes on "ordinal"
The "ordinal" preset uses a special sentinel value that the Rust renderer converts into
ordinal suffixes (1st, 2nd, 3rd, 4th, …). This is implemented natively in the renderer
and does not map to a standard d3-format string.
Notes on "percent"
d3-format's .1% multiplies the input by 100 and appends a % sign, so it expects
input in the 0–1 range. There is no d3-format escape for a trailing literal %, so if
your data is already in the 0–100 range (e.g. 45.2, not 0.452) you cannot append a
% glyph with a raw format string. Divide the values by 100 first and use the percent
preset:
# Data is already in percent form (e.g. 45.2, not 0.452)
df = df.with_columns((pl.col("rate") / 100).alias("rate"))
chart.configure_axis(label_format="percent")  # renders 45.2%
Time presets
These presets apply to temporal (T) axes. They use strftime-style patterns.
| Preset | Pattern | Example output | When to use |
|---|---|---|---|
"date_short" |
%b %-d |
Jan 5 | Compact dates (day of year) |
"date_long" |
%B %-d, %Y |
January 5, 2026 | Full date labels |
"date_iso" |
%Y-%m-%d |
2026-01-05 | ISO 8601, machine-readable |
"month" |
%b |
Jan | Monthly axis, year from context |
"month_year" |
%b %Y |
Jan 2026 | Monthly axis with year |
"year" |
%Y |
2026 | Annual axis |
"time" |
%H:%M |
14:30 | 24-hour time |
"time_12h" |
%-I:%M %p |
2:30 PM | 12-hour time |
"datetime" |
%b %-d, %H:%M |
Jan 5, 14:30 | Date and time combined |
Notes on platform portability
The %-d and %-I patterns (no-zero-padded day/hour) are Linux-specific strftime
extensions. On Windows, use %#d and %#I instead. On macOS and Linux, %-d is
supported.
Using raw format strings
When no preset covers your case, label_format_raw accepts any valid d3-format string
(for quantitative axes) or strftime pattern (for temporal axes):
# Two decimal places, no thousands separator
chart.configure_axis(label_format_raw=".2f")

# Abbreviated currency (SI prefix): 1_400_000 → "$1.4M", 950_000 → "$950k"
chart.configure_axis(label_format_raw="$.2s")

# Custom date format
chart.configure_axis(label_format_raw="%d/%m/%Y")
For the full d3-format spec, see d3-format documentation.
Programmatic preset resolution
You can resolve a preset to its underlying format string in Python:
from ferrum import resolve_format

resolve_format("currency")     # "$,.0f"
resolve_format("date_short")   # "%b %-d"
resolve_format("ordinal")      # "__ordinal__"  (Rust-side sentinel)
resolve_format raises ValueError for unknown preset names.
Per-axis vs. chart-level format
The same format options are available at two scopes:
Chart level (applies to all axes that don't have a per-channel override):
Per-channel (applies only to that specific encoding's axis):
Per-channel always wins over chart-level configure. Use chart-level for a sensible default and per-channel to override for one axis.
Examples
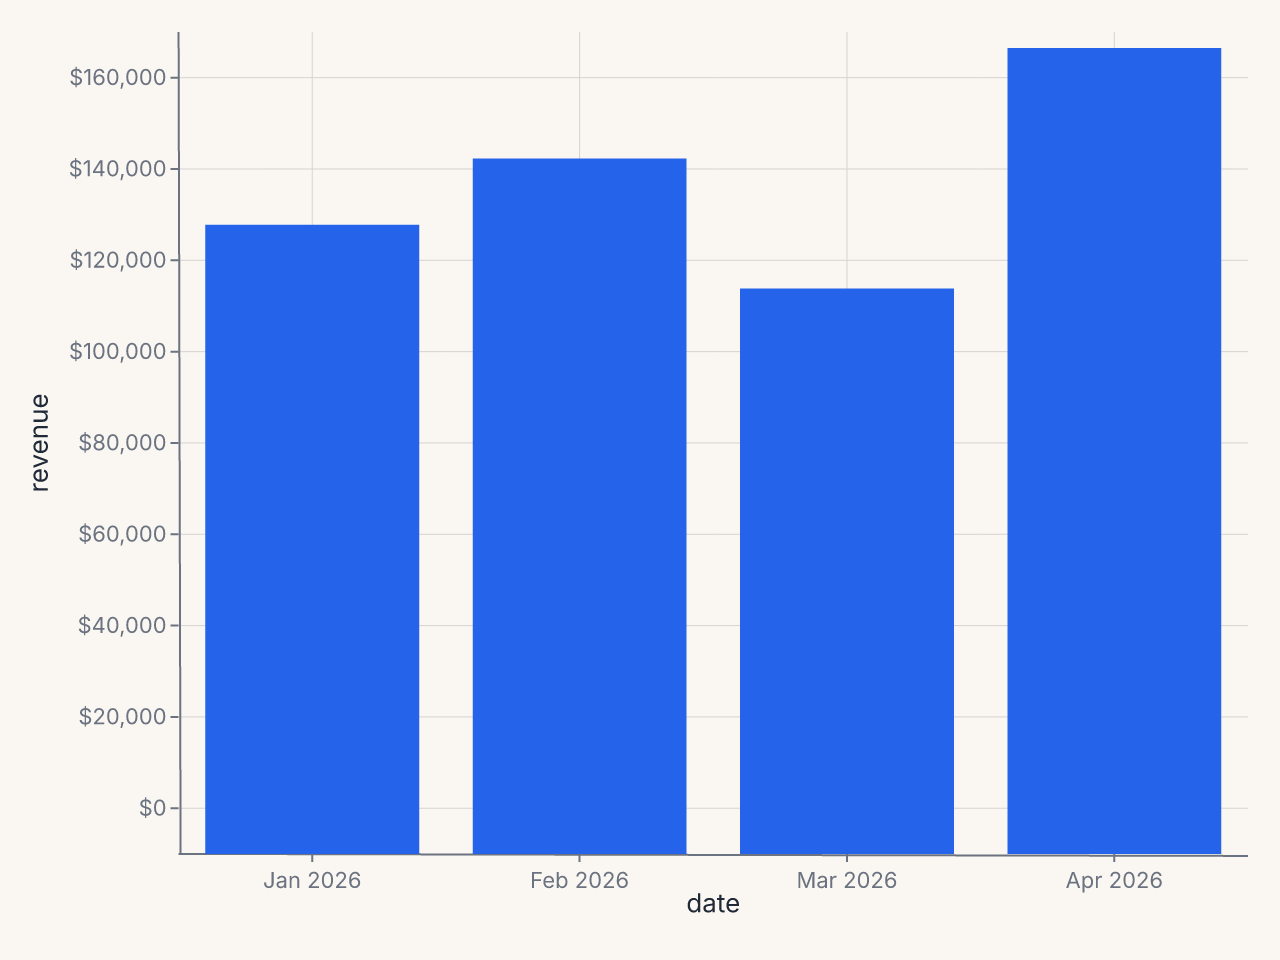
Revenue chart with currency y and short date x
import ferrum as fm
import polars as pl

df = pl.DataFrame({
    "date": ["Jan 2026", "Feb 2026", "Mar 2026", "Apr 2026"],
    "revenue": [125000, 138500, 112000, 161000],
})

chart = (
    fm.Chart(df)
    .mark_bar()
    .encode(x="date:N", y="revenue:Q")
    .configure(
        axis_y=fm.AxisConfig(label_format="currency"),
    )
)
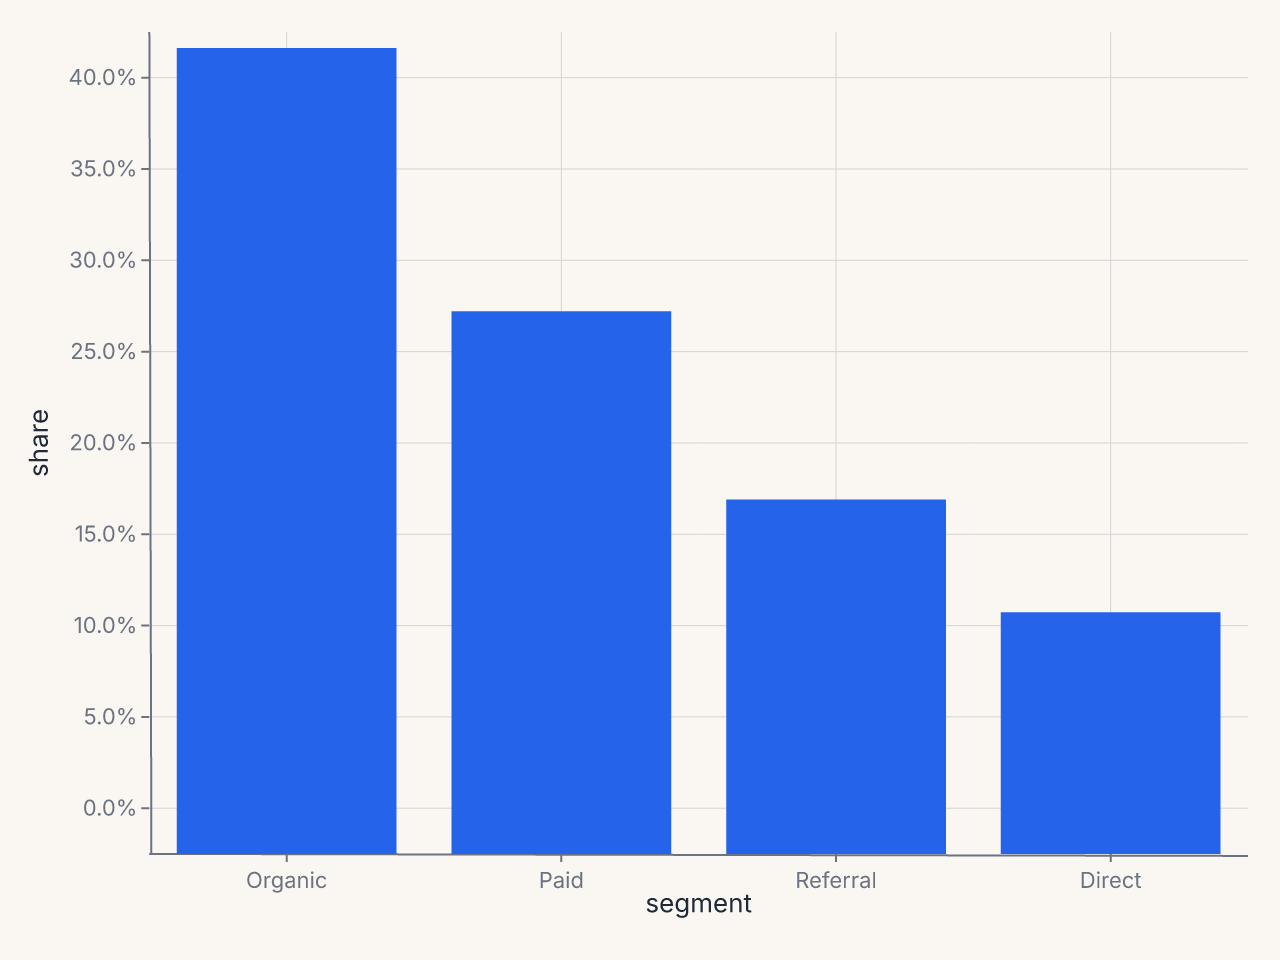
Percentage axis
df = pl.DataFrame({
    "segment": ["Organic", "Paid", "Referral", "Direct"],
    "share": [0.42, 0.28, 0.18, 0.12],
})

chart = (
    fm.Chart(df)
    .mark_bar()
    .encode(x="segment:N", y="share:Q")
    .configure_axis(y=True, x=False, label_format="percent")
)