Themes
A theme is a bundle of style decisions — background, typography, mark color, grid, axes, palettes, padding — that applies uniformly across a chart. Themes are values, not state: you construct a Theme and pass it where you want it. Nothing mutates global module state, and no chart is "secretly" themed by an import side-effect.
Three layers of theme control let you reach for the right scope: per-chart, process-default, and scoped via a context manager. Per-chart always wins.
Built-in themes
Ferrum ships twelve built-in themes accessible as attributes of [ferrum.themes][]. Three are original identities designed for Ferrum; the rest are established editorial and publication styles.
Ferrum originals
| Name | Character |
|---|---|
default / paper_ink |
Warm cream background (#FAF7F2), blue lead marks, warm grid. The default identity. |
slate_citrus |
Dark navy (#111827), vibrant neon accents, lime/cyan categorical cycle. |
arctic_signal |
Cool white (#F8FAFC), sky blue lead mark, precise signal palette. |
Established styles
| Name | Character |
|---|---|
observable |
White background, tableau blue marks, neutral gray grid. Matches Observable Plot's defaults. |
minimal |
No grid, no axis lines, generous padding. |
dark |
Dark navy (#1a1a2e), light text, dark2 palette. |
publication |
Print-ready: white background, no grid, black strokes, bold centered title. |
economist |
Light blue background (#d3e0e6), red title accents, Set1 palette. |
fivethirtyeight |
Grey background (#f0f0f0), Set1 palette, bold start-anchored title. |
solarized_light |
Warm cream (#fdf6e3), muted teal text, Set2 palette. |
solarized_dark |
Dark teal (#002b36), warm-light text, Set2 palette. |
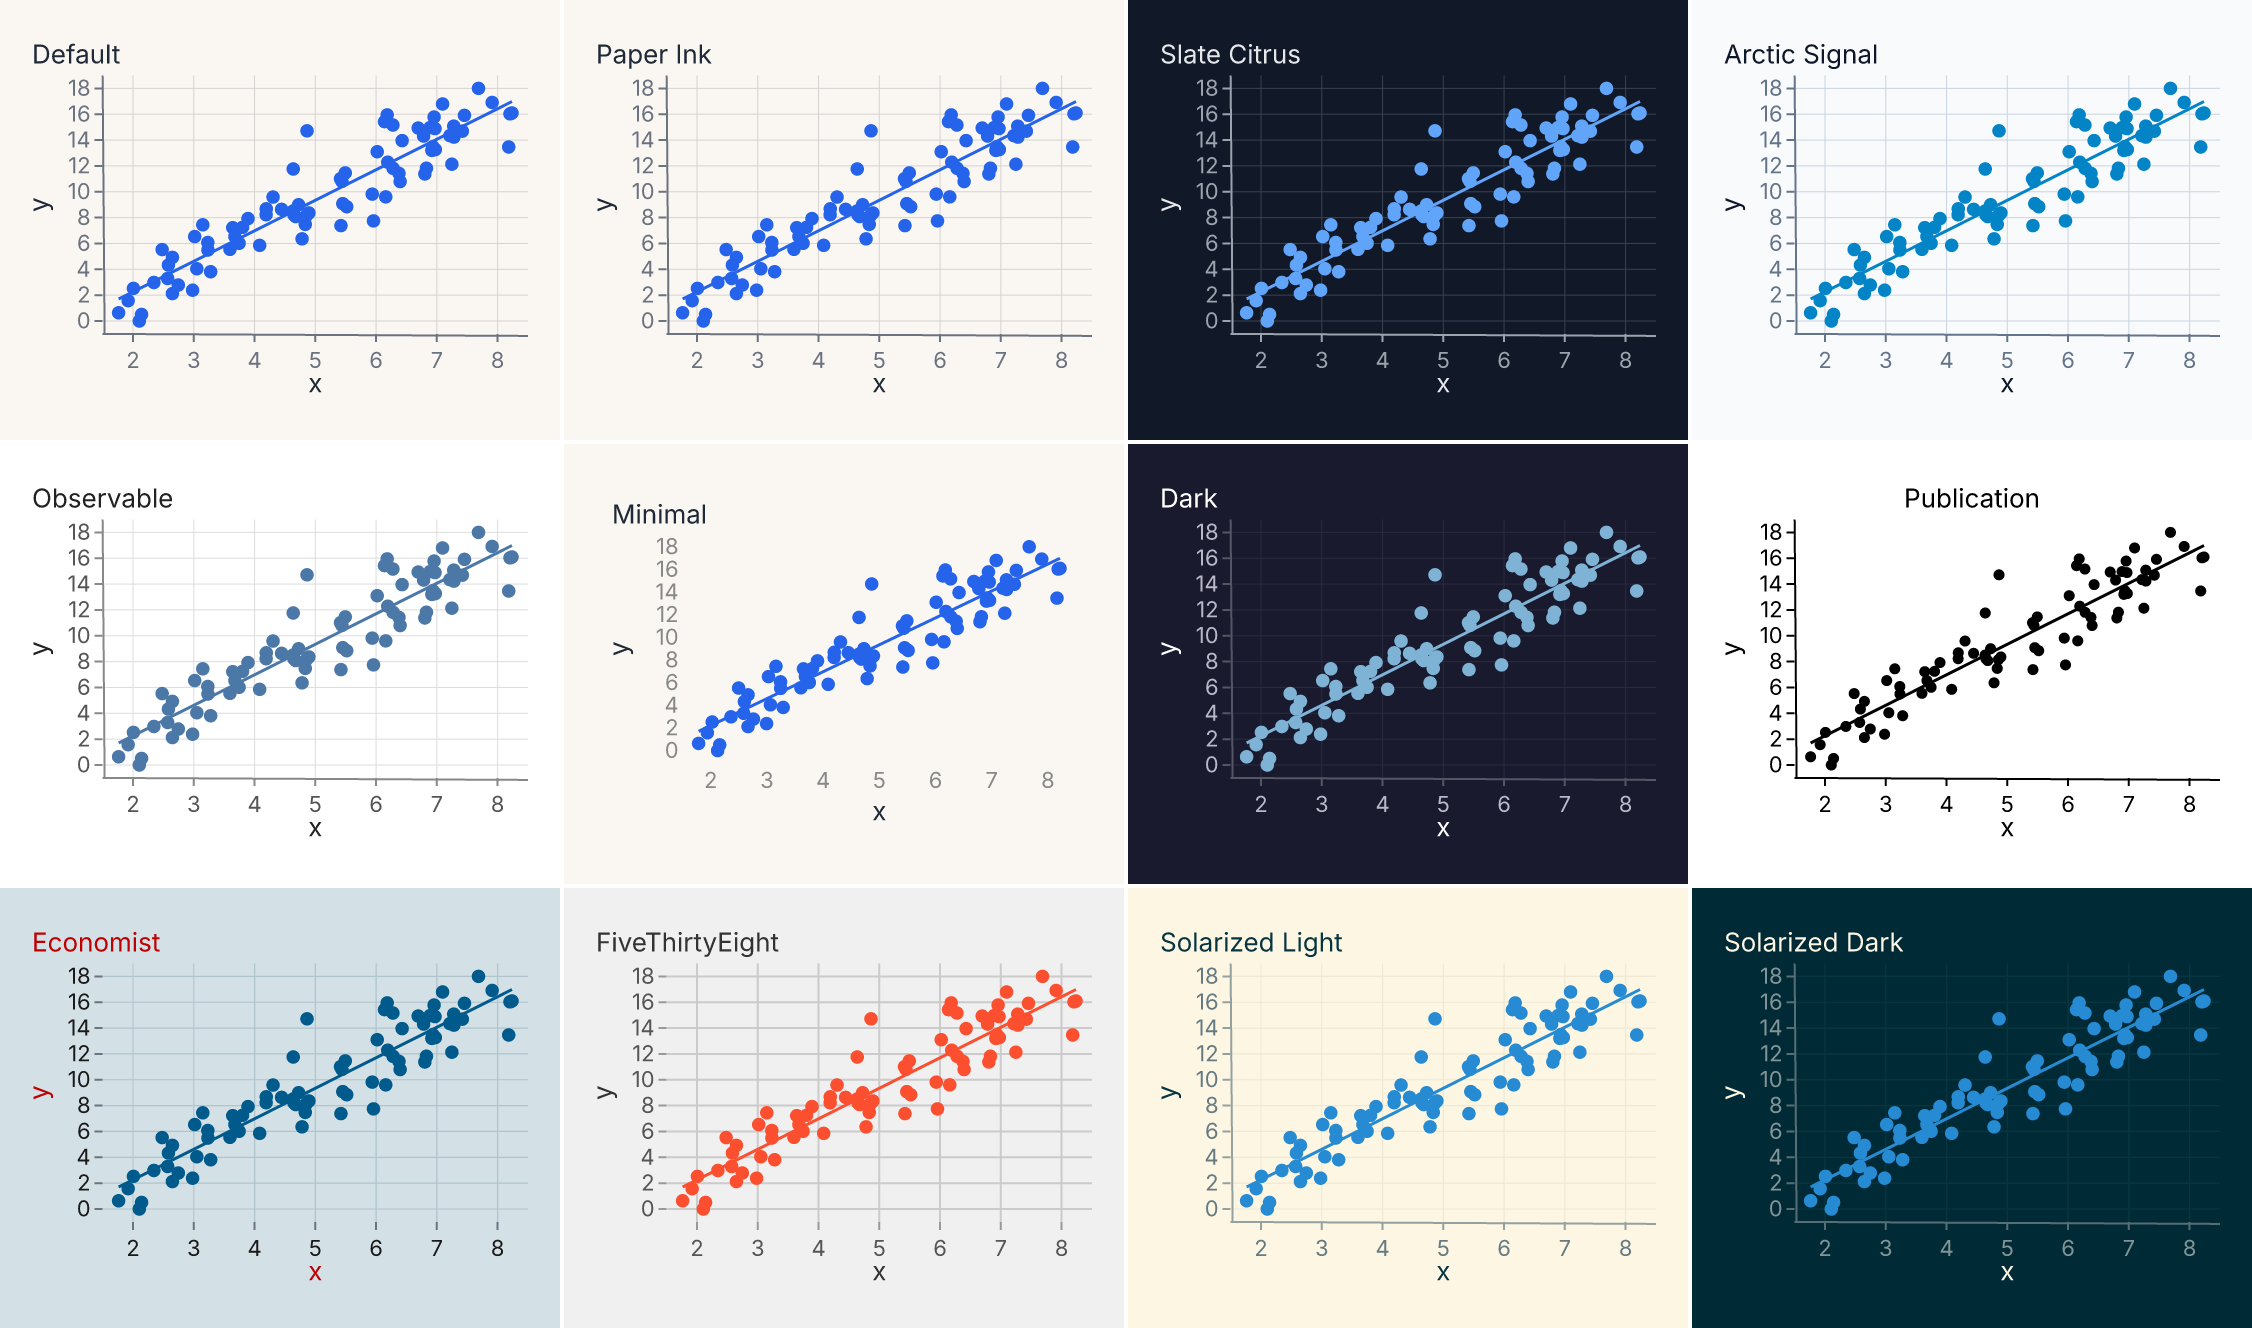
Visual comparison
All twelve built-in themes applied to the same scatter-with-smooth chart:
Applying a theme
Apply a theme to a chart:
import ferrum as fm
import polars as pl
from sklearn.datasets import load_iris

raw = load_iris()
iris = pl.DataFrame(raw.data, schema=["sepal_length", "sepal_width", "petal_length", "petal_width"]).with_columns(
    species=pl.Series([raw.target_names[t] for t in raw.target])
)
chart = (
    fm.Chart(iris)
    .mark_point()
    .encode(x="sepal_length", y="petal_length", color="species:N")
    .theme(fm.themes.slate_citrus)
)
chart
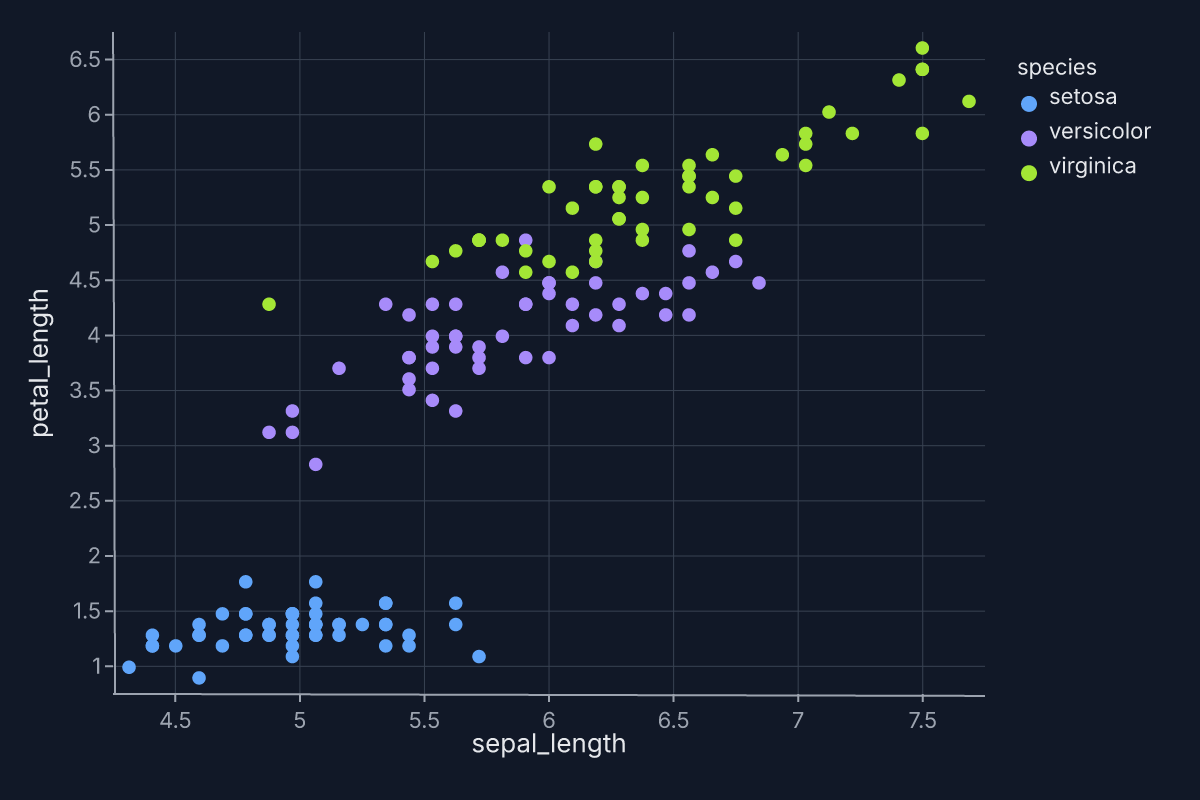
Switching themes is one method call away; the rest of the chart spec is untouched.
Theme as a value
Theme is immutable. Once constructed, it cannot be mutated. Methods like .update() return a new Theme rather than modifying the original:
import ferrum as fm

base = fm.Theme(background="#f9f9f9", grid=True, padding=16)
darker = base.update(background="#222222", mark_color="#e74c3c")
assert base != darker
assert base.to_spec_dict()["background_color"] == "#f9f9f9"
assert darker.to_spec_dict()["background_color"] == "#222222"
This immutability is structural: themes are values that compose, like encodings and marks. You can keep a "base theme" in a module and derive variants without worrying about side-effects.
Theme keys
Every key listed below is plumbed end-to-end from the Python Theme(...) constructor through the Rust renderer. Unknown keys raise ValueError at construction time — there are no silently ignored keys.
Canvas
| Key | Type | What it controls |
|---|---|---|
background |
str | Chart background as a CSS hex string. |
padding |
float | Chart padding in pixels (all four sides). |
Typography
| Key | Type | What it controls |
|---|---|---|
font_family |
str | Default typeface for body text. |
font_weight |
str | Default weight ("normal", "bold"). |
font_color |
str | Default text color. |
font_size |
float | Default text size. |
title_font_family |
str | Chart title typeface (falls back to font_family). |
title_font_size |
float | Chart title size. |
title_font_weight |
str | Chart title weight. |
title_color |
str | Chart title color (falls back to font_color). |
title_anchor |
str | Title alignment: "start", "middle", or "end". |
title_offset |
float | Vertical offset for the title. |
label_font_family |
str | Tick label typeface (falls back to font_family). |
label_color |
str | Tick label color (falls back to font_color). |
Grid
| Key | Type | What it controls |
|---|---|---|
grid |
bool | Grid |
Whether to draw grid lines, or a Grid value for major/minor control. |
grid_color |
str | Grid line color. |
grid_width |
float | Grid line width. |
grid_dash |
list | Dash pattern (e.g. [5, 3]). |
grid_opacity |
float | Grid line opacity. |
Major and minor gridlines with fm.Grid
Passing a bool (grid=True/False) toggles a single level of gridlines. For two
levels — major lines at the labelled ticks and lighter minor lines between them —
pass a Grid value instead:
Grid carries per-level styling: major_color/minor_color, major_width/minor_width,
major_dash/minor_dash, and major_opacity/minor_opacity. The bare color, width,
dash, and opacity arguments are a shorthand that sets both levels; an explicit
major_*/minor_* overrides that level. So fm.Grid(color="#f5f5f5") styles both major
and minor the same, while fm.Grid(color="#eeeeee", minor_color="#f8f8f8") keeps major at
#eeeeee and lightens only the minors.
Notes:
- Minor gridlines render on continuous axes only (linear, log, time, pow, sqrt, symlog).
Categorical and discretizing axes have no continuum to subdivide, so
minor=Trueis a documented no-op there — no error, no extra lines. - Log axes place minors at the standard 2–9 intra-decade multiples (crowding toward each decade top), not at uniform subdivisions.
- Gridlines coincide with the data. On a continuous axis, a major gridline at value v lands exactly where a data mark at v renders; minors subdivide between them on the same grid.
Grid is theme-level. For per-chart gridline overrides see
.configure_grid().
Axes
| Key | Type | What it controls |
|---|---|---|
axis_line |
bool | Whether to draw axis strokes. |
axis_line_color |
str | Axis stroke color. |
axis_line_width |
float | Axis stroke width. |
tick_color |
str | Tick mark color. |
tick_size |
float | Tick mark length. |
tick_width |
float | Tick mark width. |
Marks
| Key | Type | What it controls |
|---|---|---|
mark_color |
str | Default fill/stroke for marks with no explicit color encoding. |
point_size |
float | Default radius for point marks. |
point_opacity |
float | Default opacity for point marks. |
line_stroke_width |
float | Default stroke width for line marks. |
bar_corner_radius |
float | Corner radius applied to bars. |
area_opacity |
float | Default opacity for area marks. |
opacity |
float | Global default opacity for all marks. |
These are defaults. A constant mark-style kwarg on the mark itself wins — e.g. mark_density(opacity=0.6) overrides the theme's area_opacity. See Marks & Encodings.
Palettes
| Key | Type | What it controls |
|---|---|---|
color_scheme |
str | Categorical palette. See available palettes below. |
sequential_scheme |
str | Default sequential ramp for heatmaps, density, continuous-color charts. |
diverging_scheme |
str | Default diverging ramp for correlation matrices, diverging-color charts. |
For programmatic palette access outside of themes, see ferrum.color.
Layout and decoration
| Key | Type | What it controls |
|---|---|---|
legend_orient |
str | Legend position. |
legend_direction |
str | Legend layout direction. |
legend_title_font_size |
float | Legend title size. |
axis_title_padding |
float | Space between axis title and axis. |
column_padding |
float | Spacing between columns in multi-panel layouts. |
row_padding |
float | Spacing between rows in multi-panel layouts. |
strip_background_color |
str | Facet strip-title background. |
reference_line_color |
str | Color for reference lines. |
reference_line_dash |
list | Dash pattern for reference lines. |
Available palettes
Categorical
Ten named categorical palettes, selectable via color_scheme:
| Name | Origin |
|---|---|
paper_ink |
Ferrum's default — 8 balanced, perceptually distinct colors on warm cream. |
slate_citrus |
Ferrum — 8 neon-accent colors designed for dark backgrounds. |
arctic_signal |
Ferrum — 8 precise signal colors on cool white. |
tableau10 |
Tableau's 10-color palette. |
okabe_ito |
Okabe-Ito colorblind-safe palette. |
set1 |
ColorBrewer Set1. |
set2 |
ColorBrewer Set2. |
paired |
ColorBrewer Paired (12 colors). |
pastel |
ColorBrewer Pastel. |
dark2 |
ColorBrewer Dark2. |
Sequential
Twelve named sequential ramps, selectable via sequential_scheme:
| Name | Character |
|---|---|
cool_blue |
Paper Ink's default. Blue ramp on warm background. |
warm_ochre |
Warm amber ramp. |
night_blue |
Slate Citrus's default. Deep blue on dark background. |
electric_lime |
Bright lime-green ramp. |
signal_blue |
Arctic Signal's default. Sky-to-navy blue. |
ember_orange |
Warm orange-to-red ramp. |
viridis |
Perceptually uniform yellow-green-blue. |
plasma |
Perceptually uniform magenta-orange-yellow. |
magma |
Perceptually uniform black-purple-yellow. |
inferno |
Perceptually uniform black-red-yellow. |
cividis |
Colorblind-optimized blue-yellow. |
blues |
ColorBrewer sequential blues. |
Diverging
Four named diverging ramps, selectable via diverging_scheme:
| Name | Character |
|---|---|
blue_to_red |
Paper Ink's default diverging. |
cyan_to_amber |
Slate Citrus's default diverging. |
blue_to_violet |
Arctic Signal's default diverging. |
rdbu |
ColorBrewer RdBu. |
Process-default themes
When you want the same theme to apply to every chart in a notebook or script, set it once with set_default_theme():
import ferrum as fm
import polars as pl
from sklearn.datasets import load_iris

raw = load_iris()
iris = pl.DataFrame(raw.data, schema=["sepal_length", "sepal_width", "petal_length", "petal_width"]).with_columns(
    species=pl.Series([raw.target_names[t] for t in raw.target])
)
fm.set_default_theme(fm.themes.dark)
chart = (
    fm.Chart(iris)
    .mark_point()
    .encode(x="sepal_length", y="petal_length", color="species:N")
)
chart
fm.set_default_theme(fm.themes.default)
For process-level configuration defaults (width, height, renderer), see ferrum.config.
set_default_theme() does not mutate a module-level config object. It writes to a per-thread contextvars.ContextVar, which means:
- The default is scoped to the current Python interpreter context.
- Concurrent tasks (asyncio, multiprocessing, threads using contextvars) do not share defaults.
- The previous default can be restored explicitly, or implicitly via the context manager (next section).
This is the single documented exception to Ferrum's "no global mutable state" rule, and the mechanism is deliberately scope-bounded.
Scoped themes via with
For code where the theme should change for one block and revert afterward, theme_context() is a context manager:
import ferrum as fm
import polars as pl
from sklearn.datasets import load_iris
raw = load_iris()
iris = pl.DataFrame(raw.data, schema=["sepal_length", "sepal_width", "petal_length", "petal_width"]).with_columns(
species=pl.Series([raw.target_names[t] for t in raw.target])
)
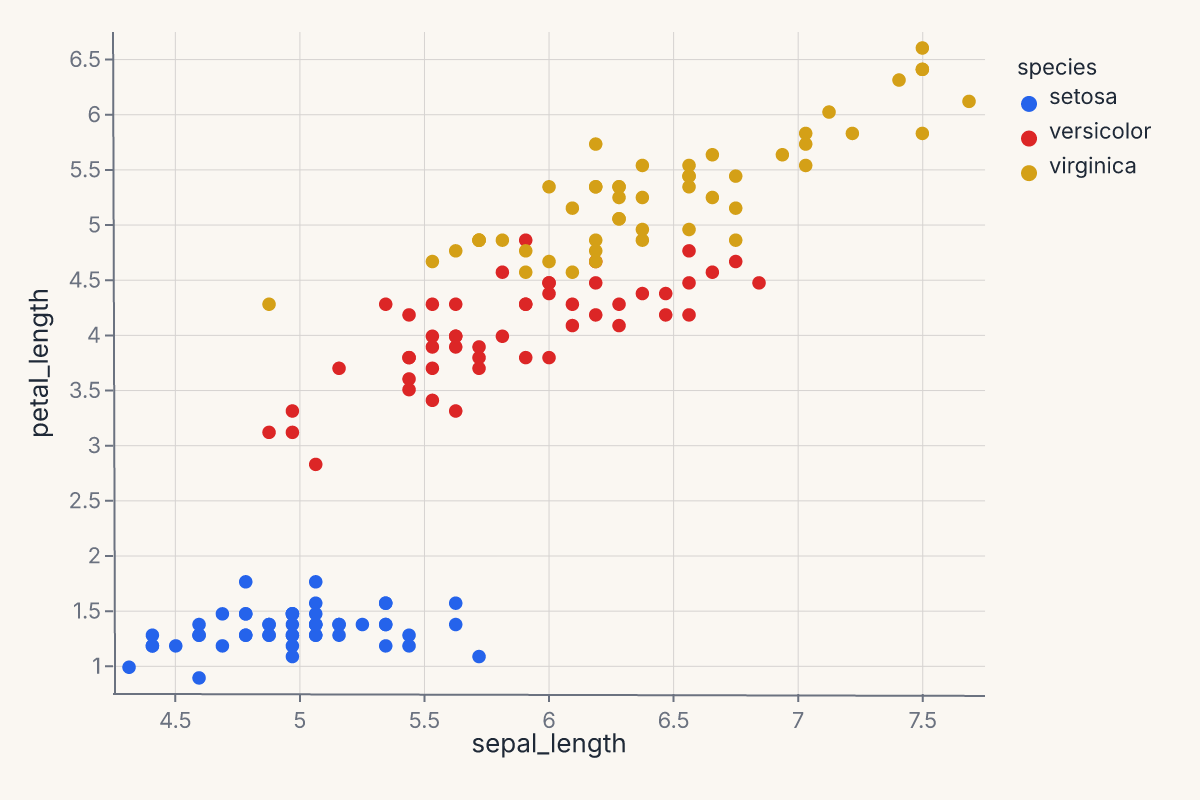
with fm.theme_context(fm.themes.publication):
publication_chart = (
fm.Chart(iris)
.mark_point()
.encode(x="sepal_length", y="petal_length", color="species:N")
)
publication_chart
assert fm.get_default_theme() == fm.themes.default

The previous default is restored on __exit__. This is the right scope for a single section of a notebook, a single figure-rendering function, or a test fixture.
Precedence
When multiple theme sources are in play:
- Per-chart
.theme(t)always wins. If a chart calls.theme(dark), that chart renders withdarkregardless of any process default. - Process default applies otherwise. A chart without an explicit
.theme()picks up whateverset_default_theme()last set (or whatevertheme_context()currently scopes). - Ferrum's built-in
default(Paper Ink) is the bottom of the stack. If nothing else is set, every chart renders with the warm cream Paper Ink identity.
Think of .theme() as a chart-level override and set_default_theme() / theme_context() as ambient defaults.
Building a custom theme
All color keys in Theme — background, mark_color, font_color, grid_color, and others — accept either a CSS #rrggbb hex string or any of the 148 CSS named colors ("steelblue", "crimson", "coral", "goldenrod", etc.). Named colors are resolved at construction time, so Theme(mark_color="steelblue") is exactly equivalent to Theme(mark_color="#4682B4").
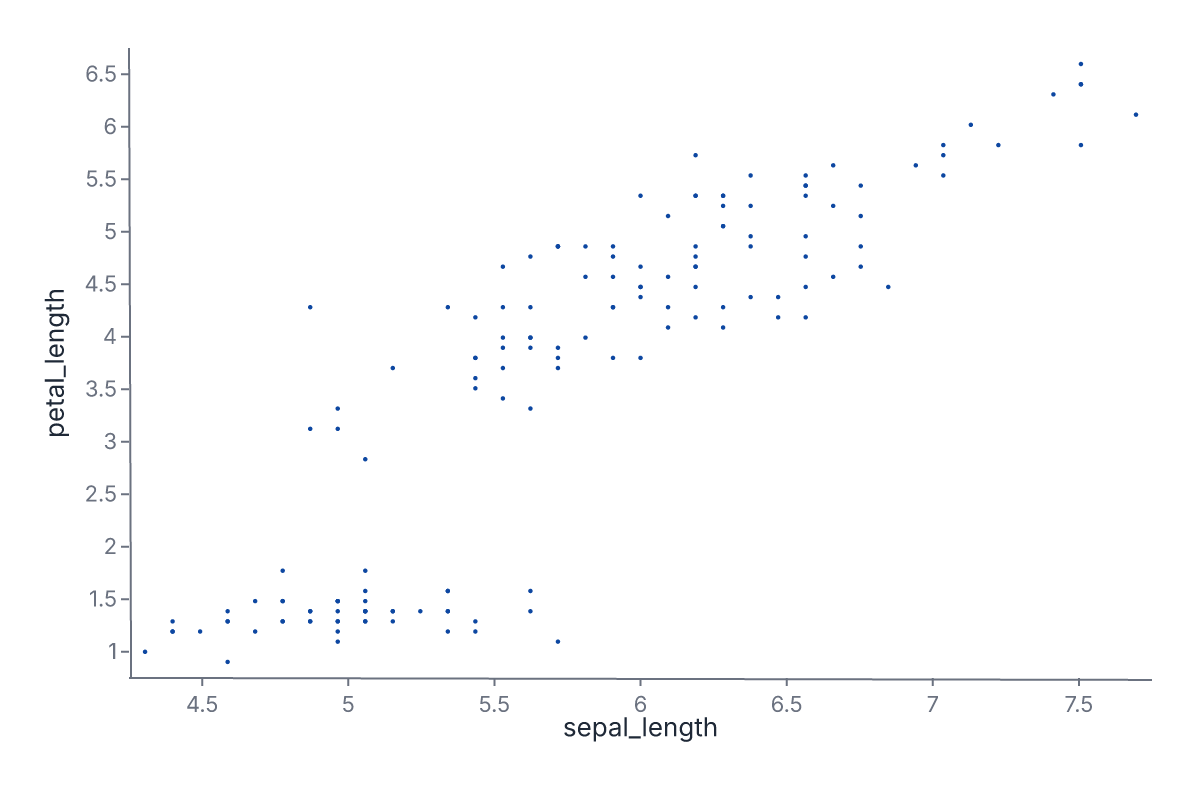
A custom theme is a Theme(...) call with the keys you want:
import ferrum as fm
import polars as pl
from sklearn.datasets import load_iris

raw = load_iris()
iris = pl.DataFrame(raw.data, schema=["sepal_length", "sepal_width", "petal_length", "petal_width"]).with_columns(
    species=pl.Series([raw.target_names[t] for t in raw.target])
)
brand = fm.Theme(
    background="#ffffff",
    mark_color="#0d47a1",
    point_size=4.0,
    grid=False,
    padding=24,
    color_scheme="tableau10",
    sequential_scheme="viridis",
)
chart = (
    fm.Chart(iris)
    .mark_point()
    .encode(x="sepal_length", y="petal_length")
    .theme(brand)
)
chart
You can also derive from a built-in using .update():
import ferrum as fm

brand = fm.themes.paper_ink.update(
    mark_color="#0d47a1",
    grid=False,
    padding=24,
)
assert brand.to_spec_dict()["mark_color"] == "#0d47a1"
assert brand.to_spec_dict()["background_color"] == "#FAF7F2"
This produces a new Theme with Paper Ink's warm background and typography but your mark color and grid preferences. The original paper_ink theme is unchanged.
Where to go next
- Marks & encodings for what gets styled by a theme.
- Composition for how themes apply across compound views.
- Figure-level helpers for the convenience entry points (most accept a
theme=keyword). - The API Reference for the full
Themeconstructor signature.