Gallery
A visual tour of Ferrum's chart surface. Every image below was rendered by Ferrum's Rust engine — no matplotlib, no browser, no external renderer. Each card includes the API call so you can reproduce it with your own data. Where both exist, helper shows the one-line shortcut and grammar shows the underlying mark + encode call — both produce the same chart.
Primitive marks
The building blocks. Each mark maps directly to a geometric shape.
-
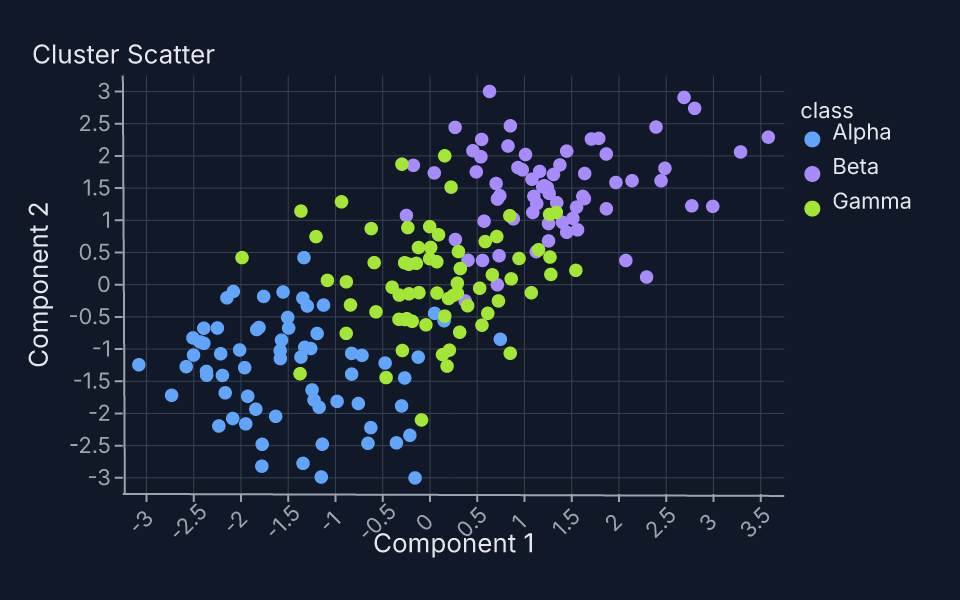
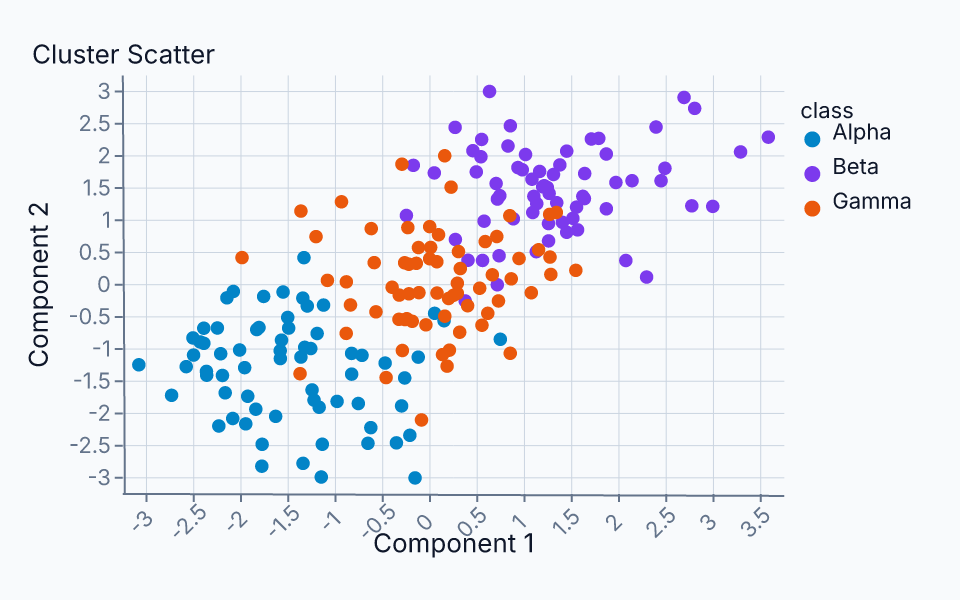
Point
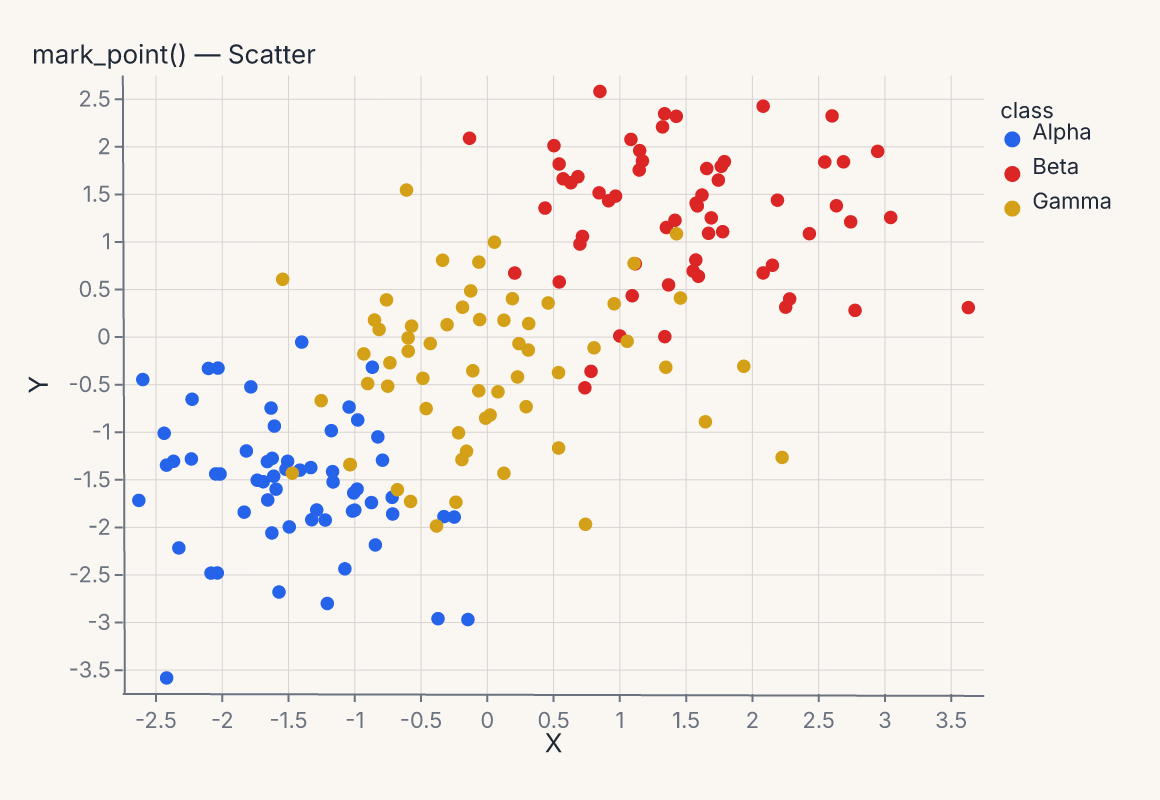
fm.Chart(df).mark_point().encode(x="x", y="y", color="class") -
Line
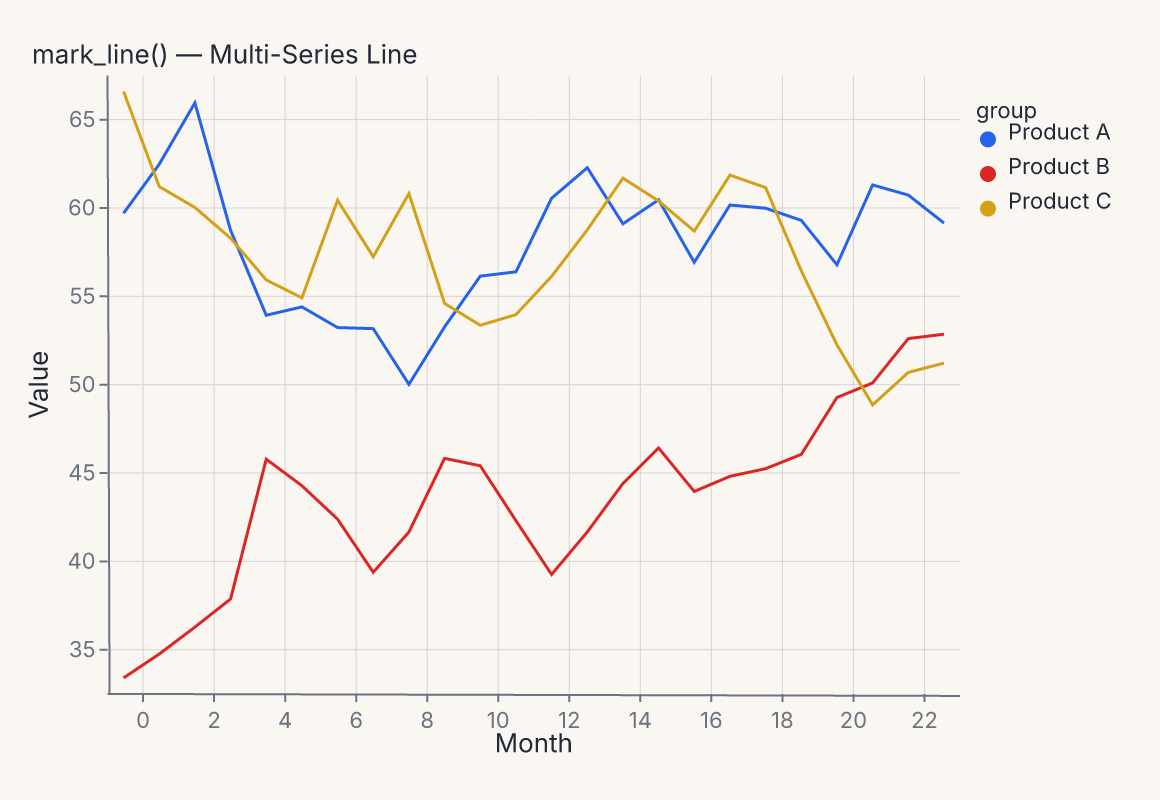
fm.Chart(df).mark_line().encode(x="month", y="value", color="group") -
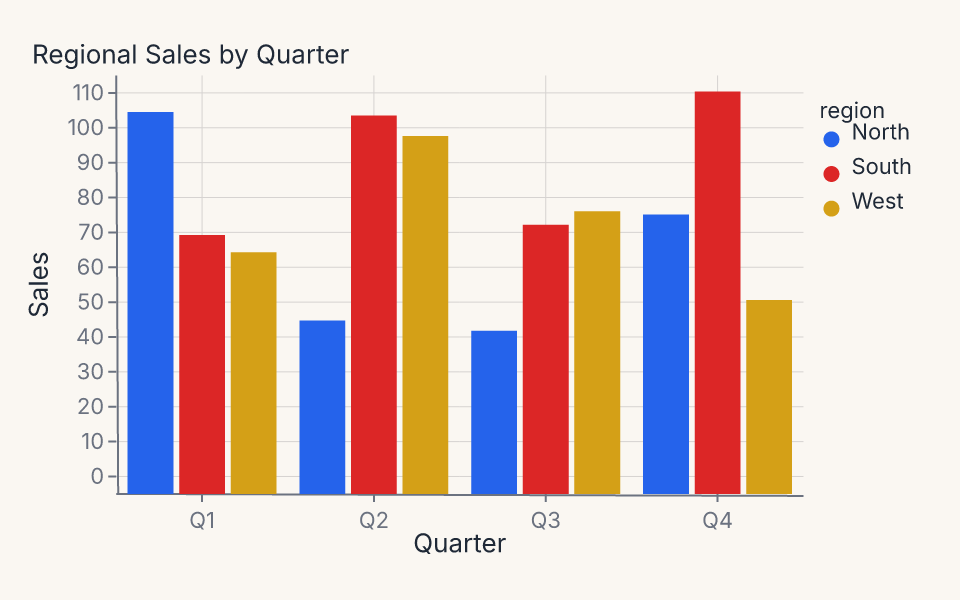
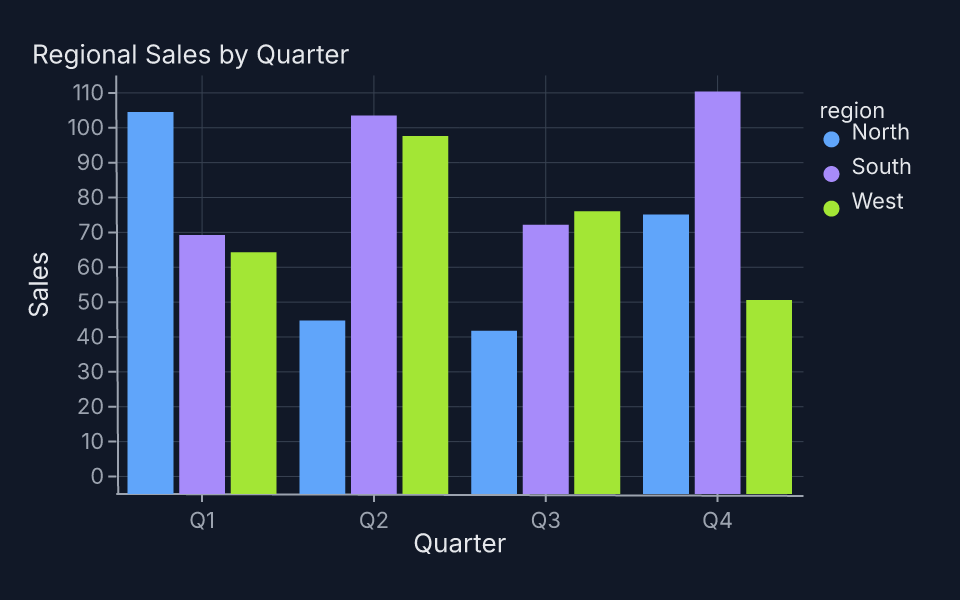
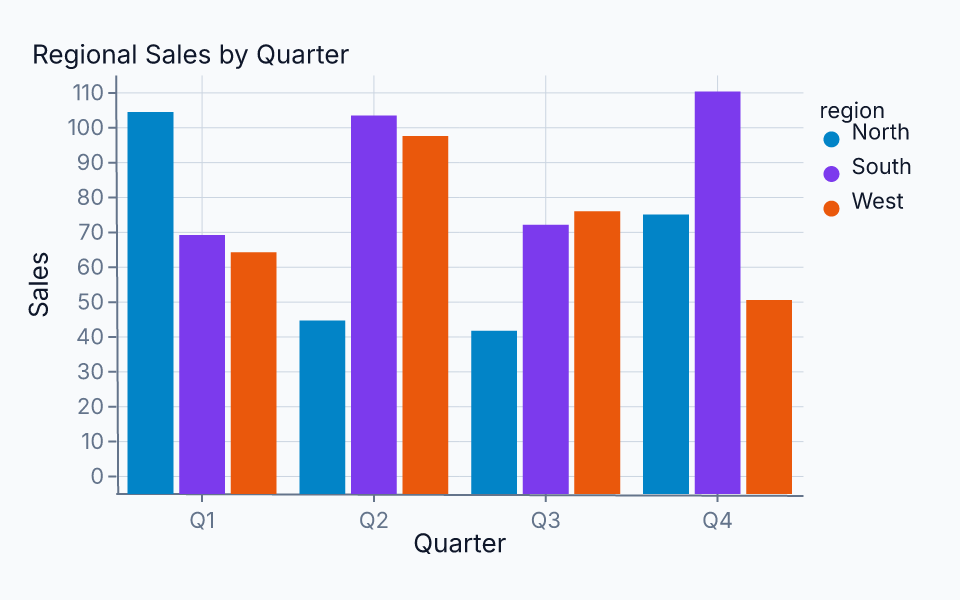
Bar
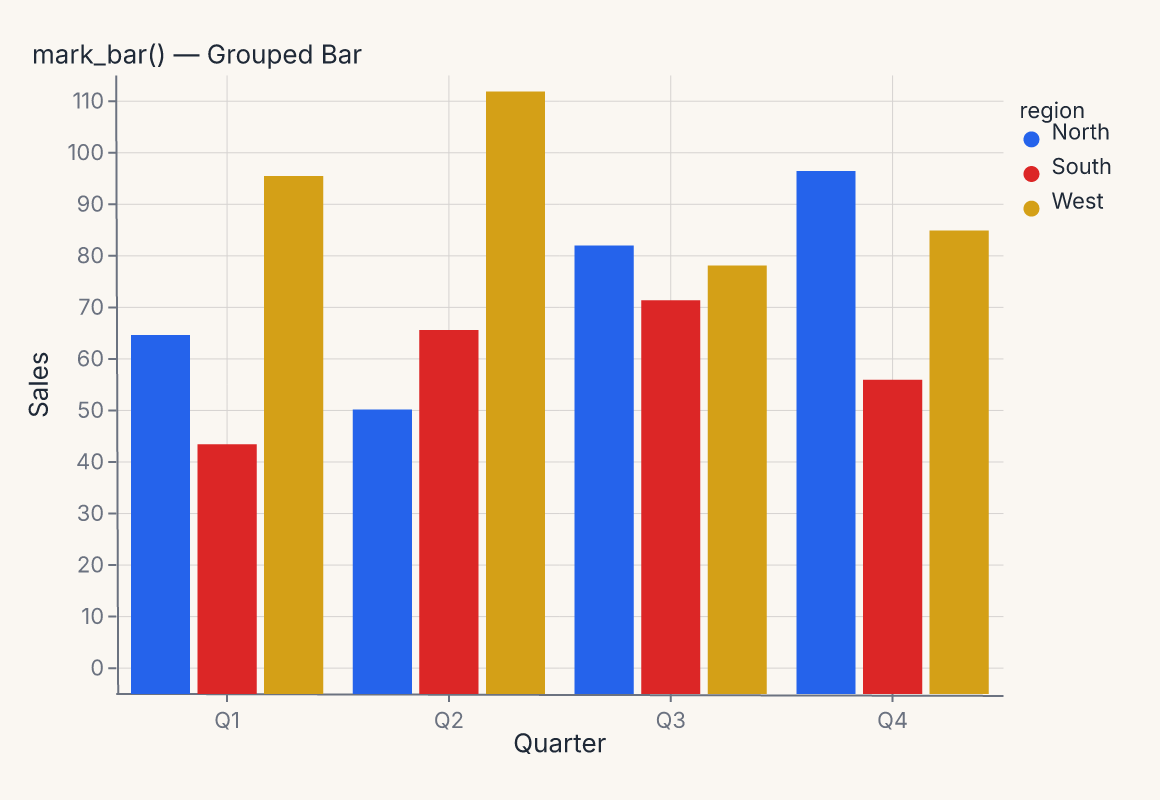
fm.Chart(df).mark_bar(position=fm.Dodge()).encode(x="quarter", y="sales", color="region") -
Area
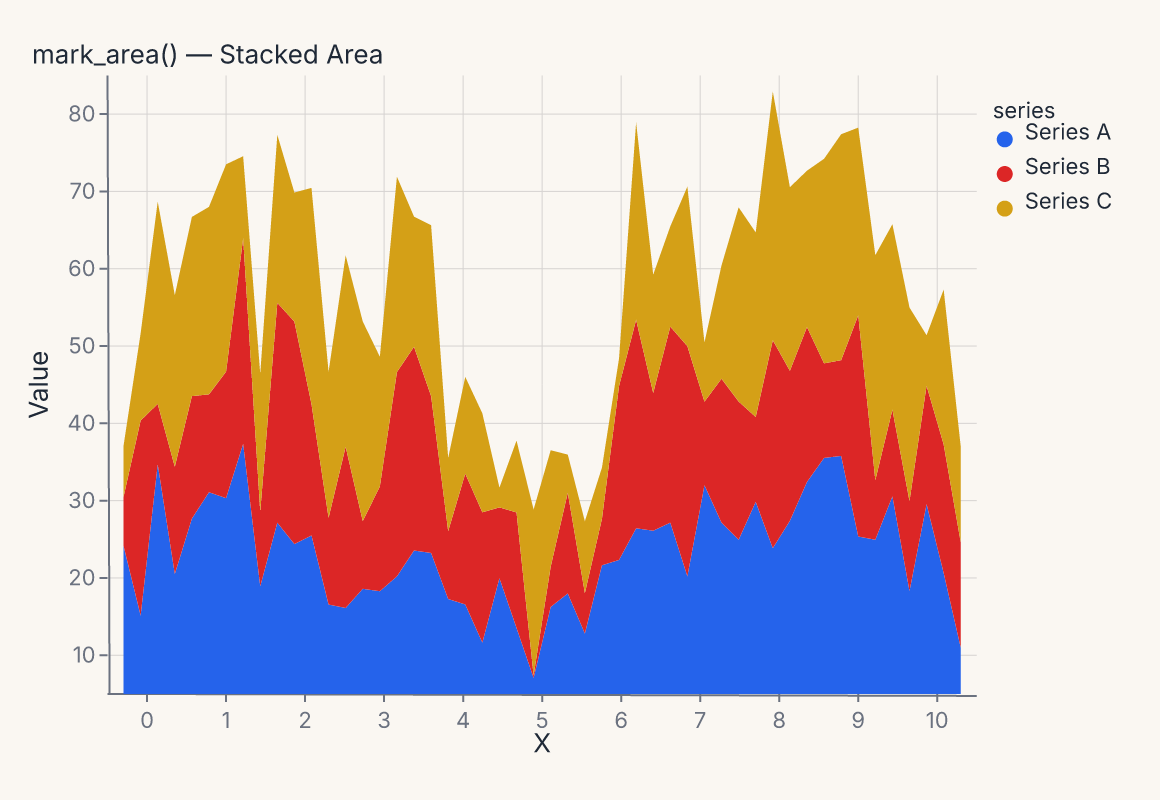
fm.Chart(df).mark_area(position=fm.Stack()).encode(x="x", y="value", color="series") -
Rule
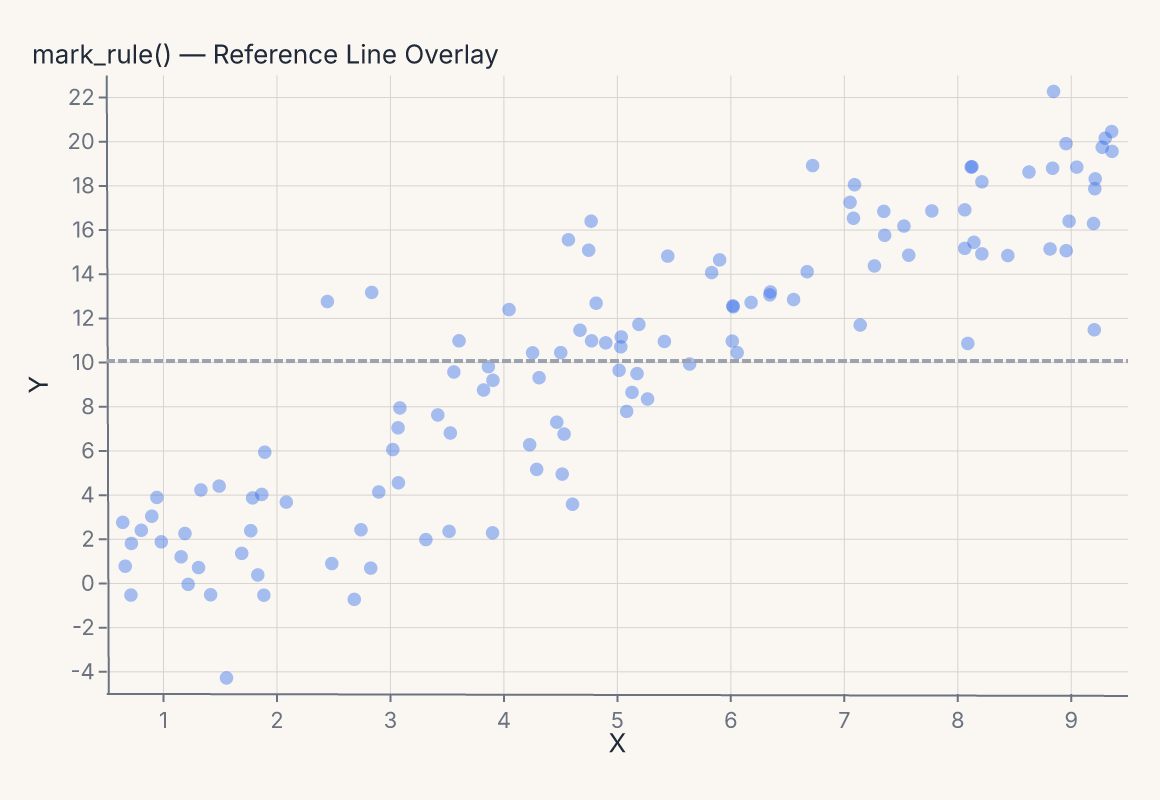
fm.Chart(df).mark_point() + fm.Chart(rule_df).mark_rule().encode(y="ref_y") -
Tick
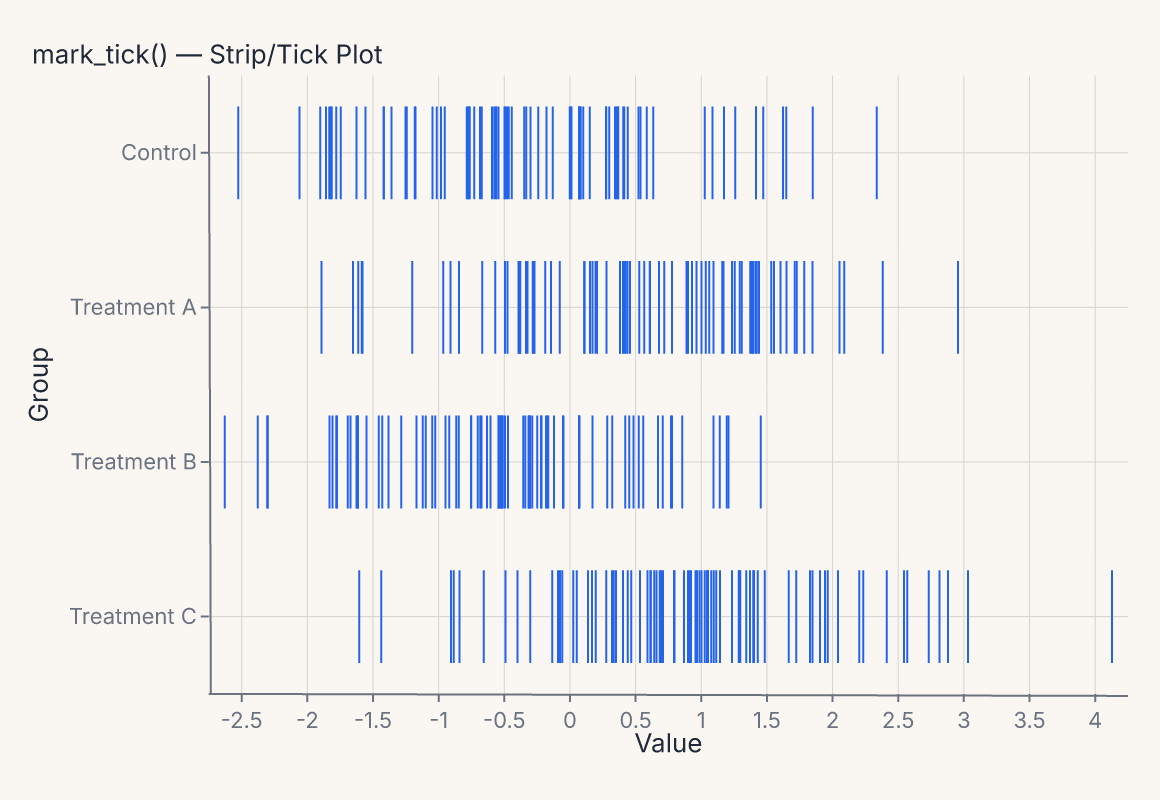
fm.Chart(df).mark_tick().encode(x="value", y="group") -
Rect
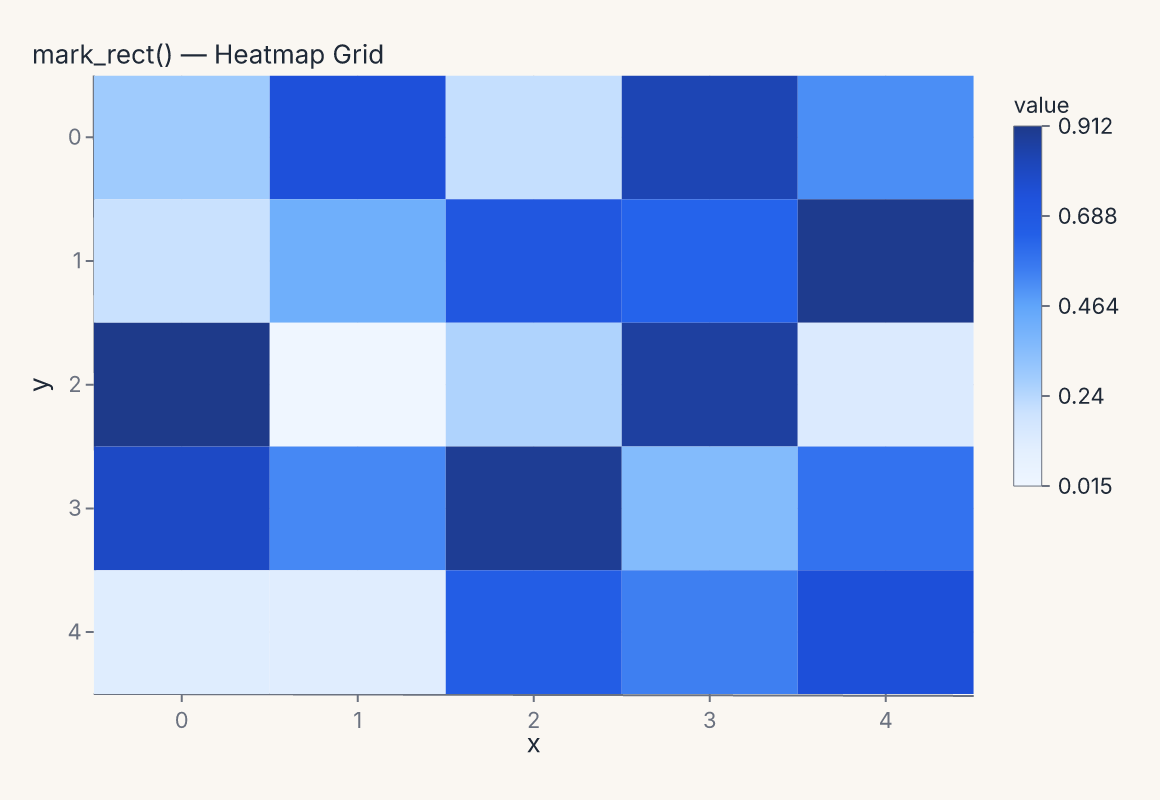
fm.Chart(df).mark_rect().encode(x="x", y="y", color="value") -
Text
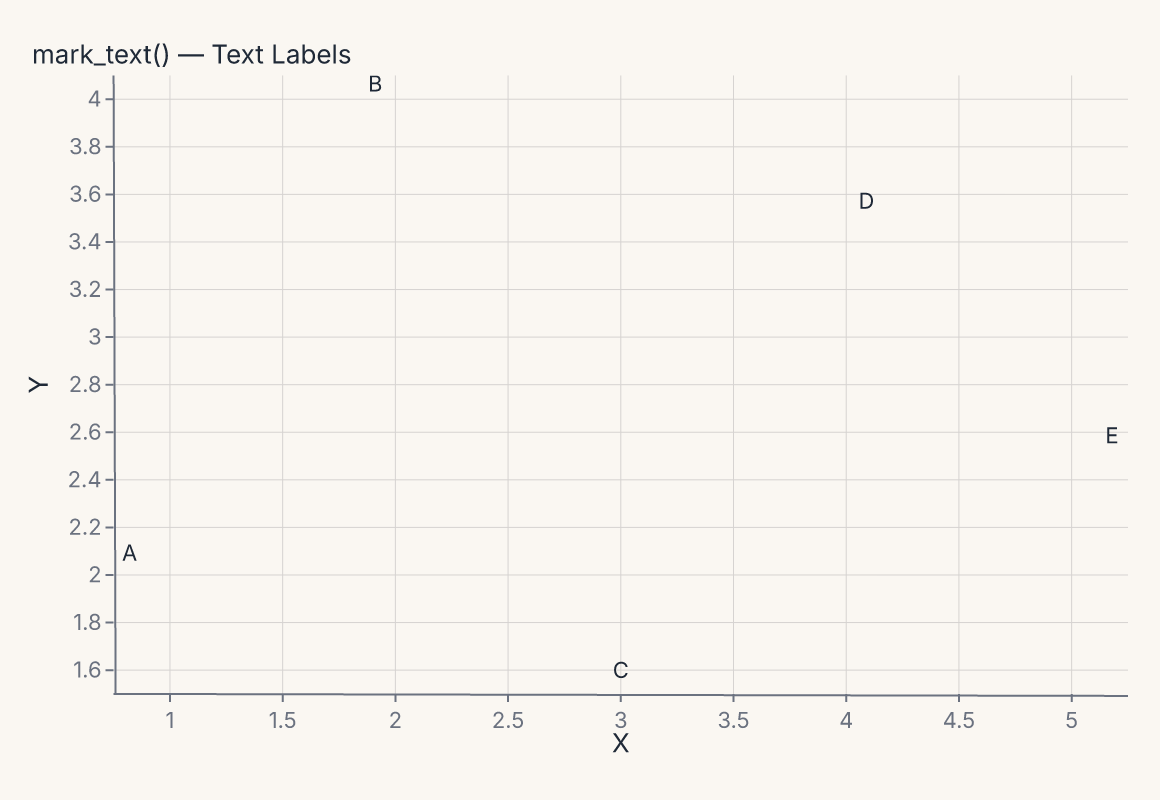
fm.Chart(df).mark_text().encode(x="x", y="y", text="label")
Statistical marks
These marks compute a transform on your data before rendering — KDE, binning, smoothing, quantiles.
-
Histogram
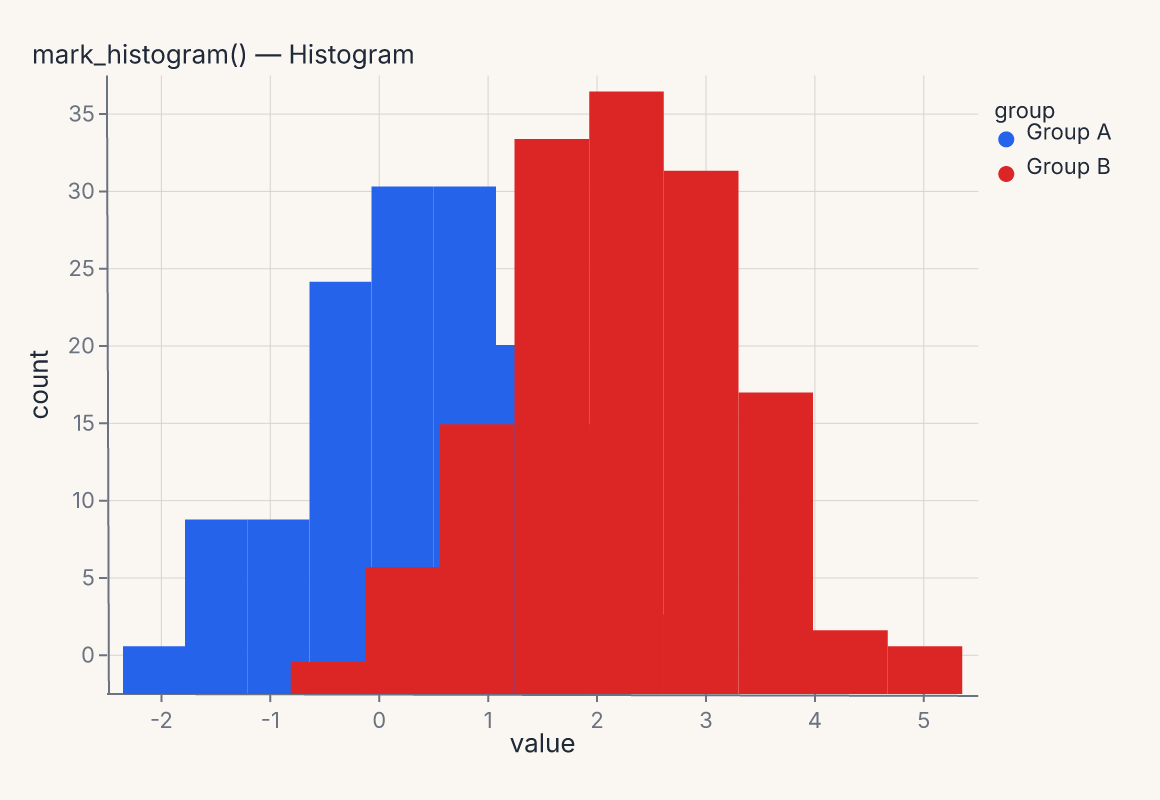
helper:
fm.displot(df, x="value", hue="group", kind="hist")grammar:
fm.Chart(df).mark_histogram(groupby="group").encode(x="value", color="group") -
Density (KDE)
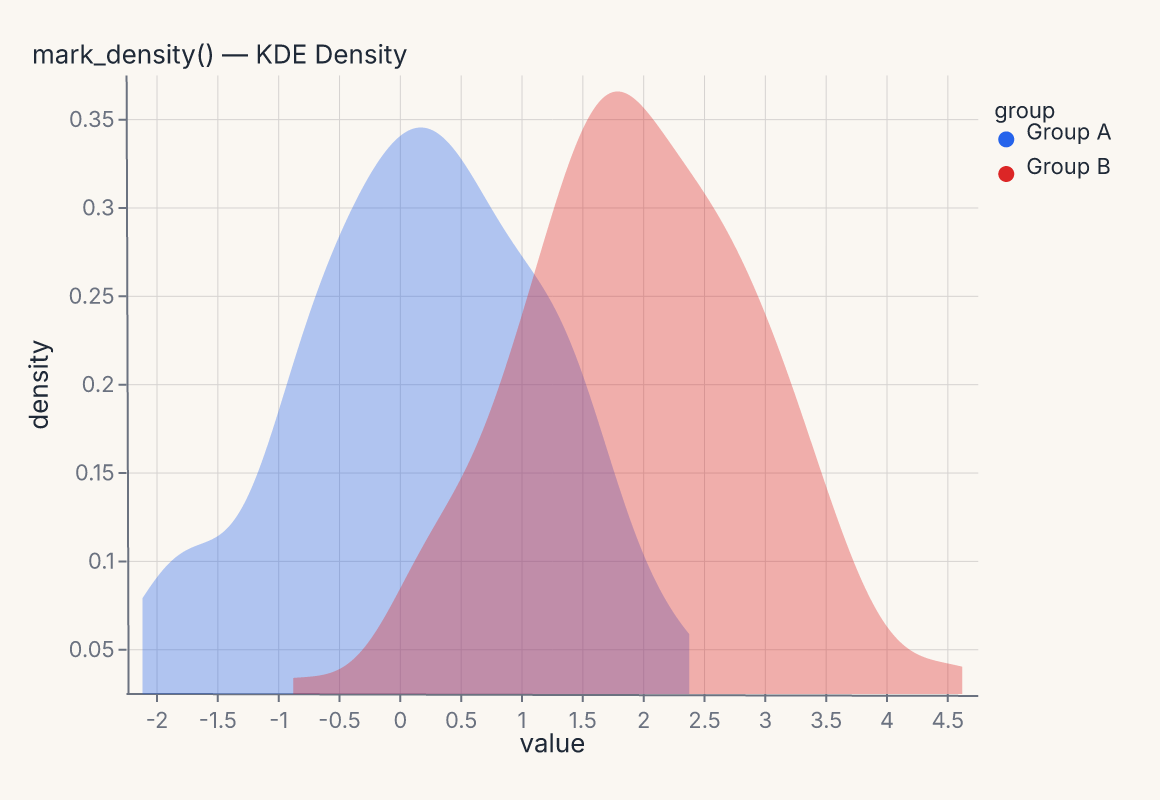
helper:
fm.displot(df, x="value", hue="group", kind="kde")grammar:
fm.Chart(df).mark_density(groupby="group").encode(x="value", color="group") -
Smooth (linear)
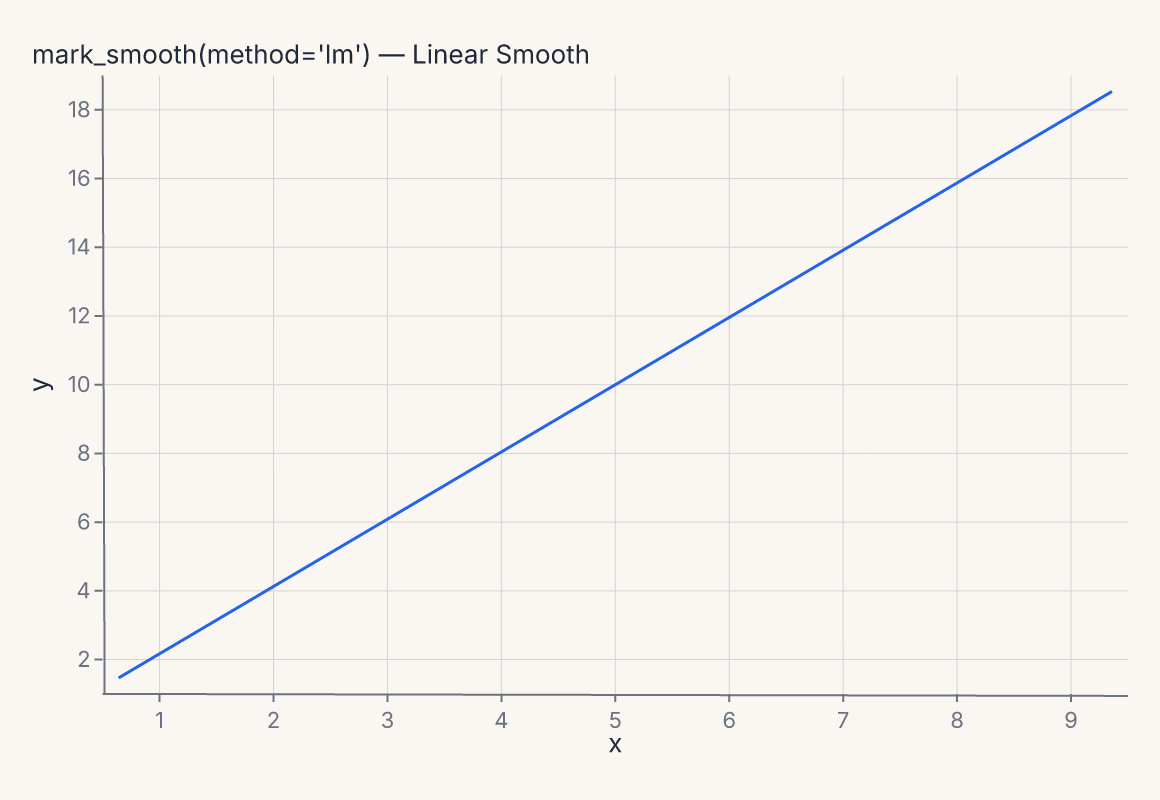
helper:
fm.lmplot(df, x="x", y="y")grammar:
fm.Chart(df).mark_smooth(method="lm").encode(x="x", y="y") -
Smooth (LOESS + CI)
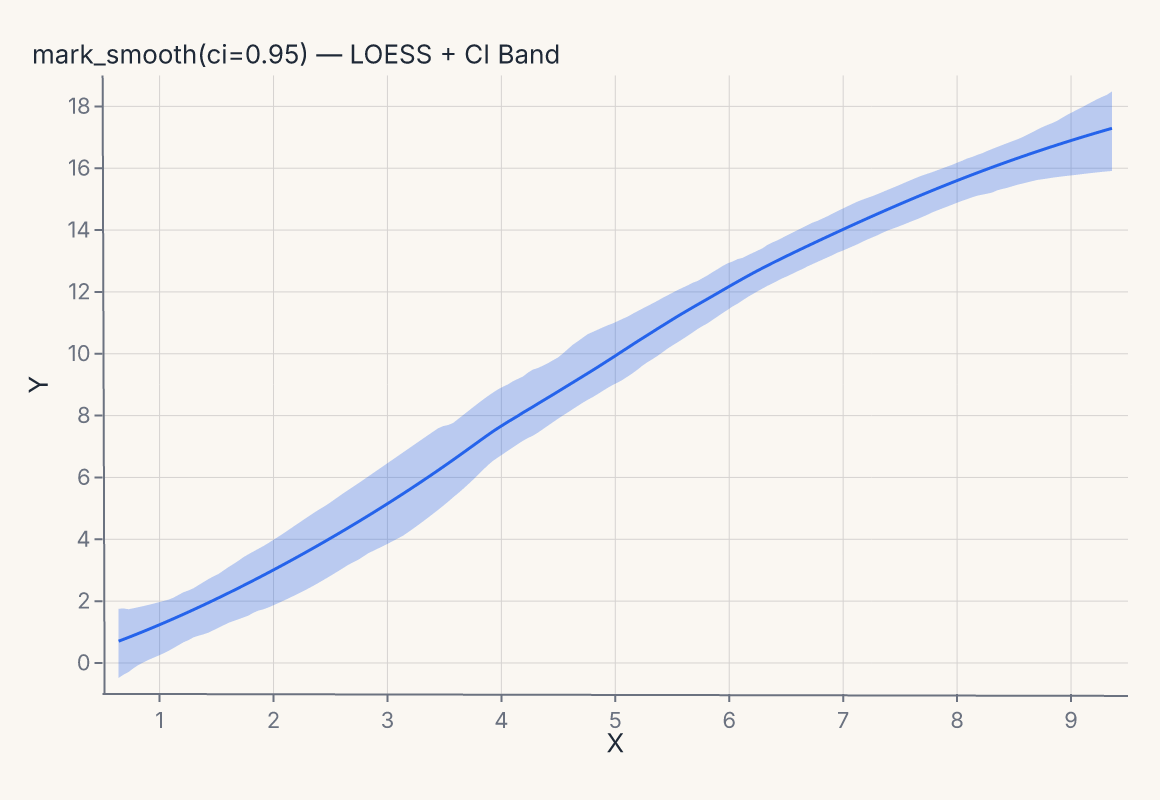
helper:
fm.lmplot(df, x="x", y="y", method="loess")grammar:
fm.Chart(df).mark_smooth(ci=0.95).encode(x="x", y="y") -
Contour
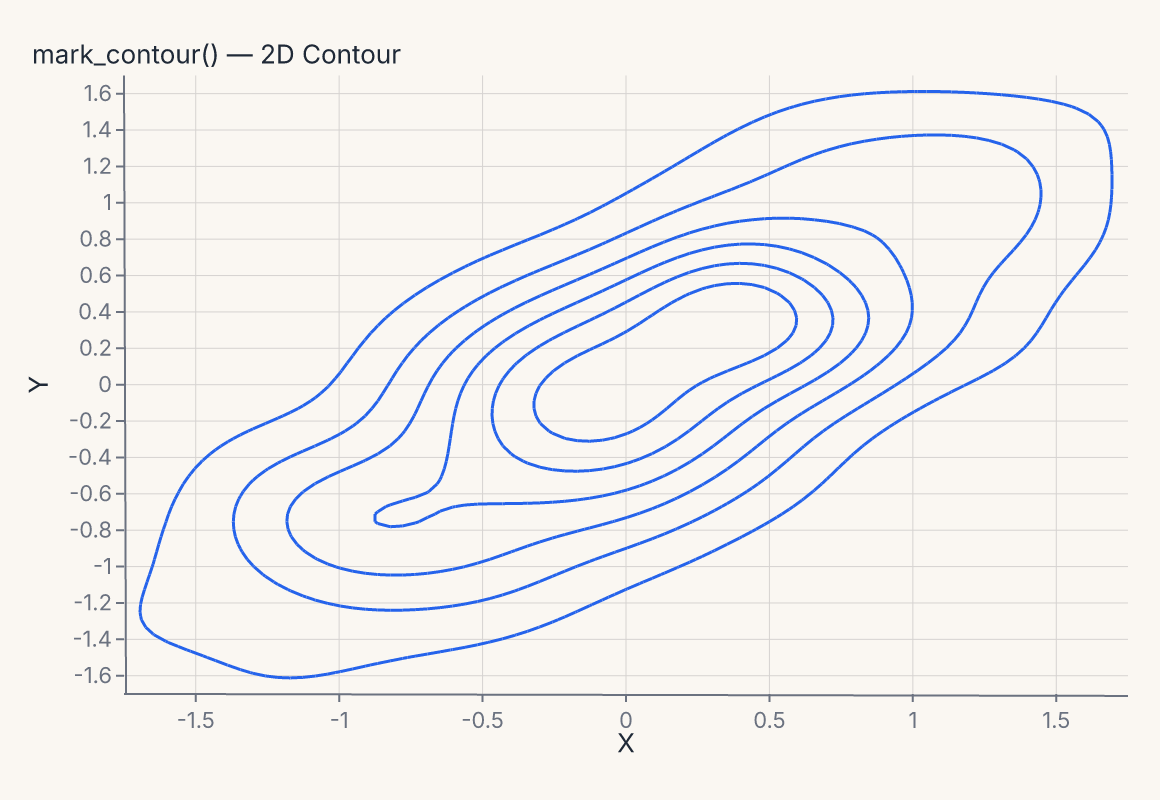
fm.Chart(df).mark_contour().encode(x="x", y="y") -
QQ plot
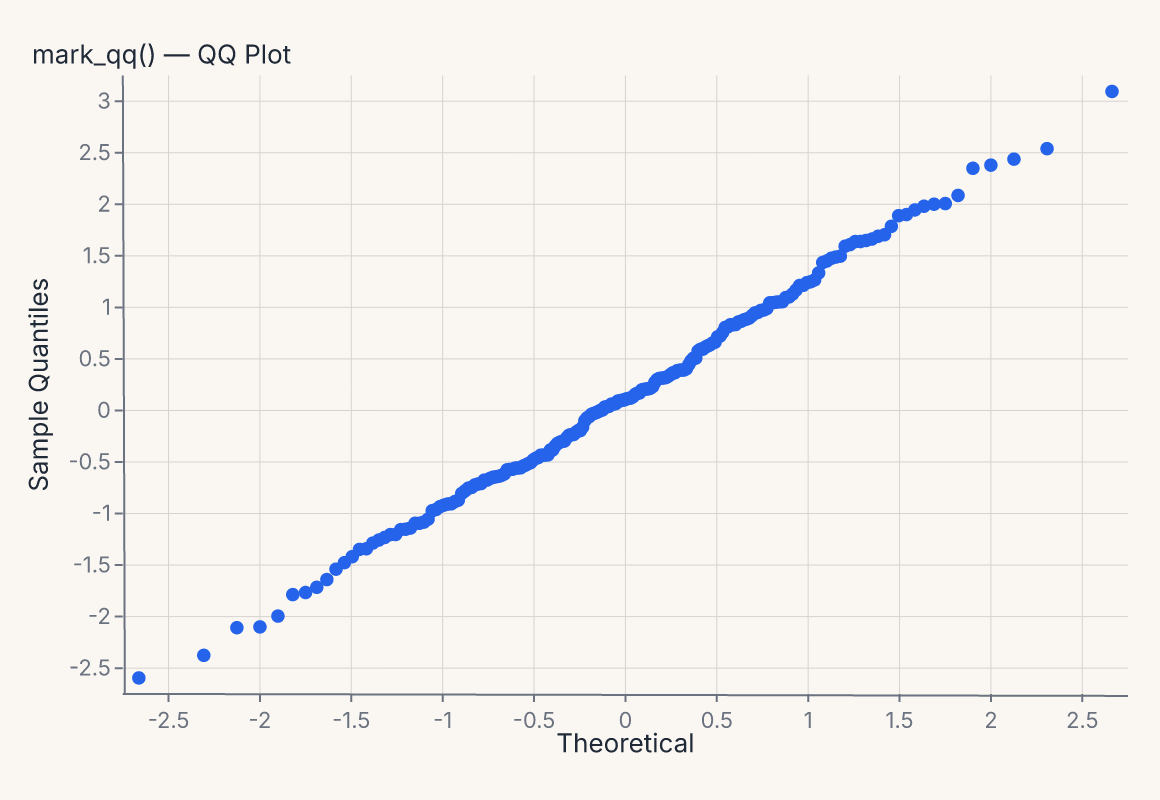
fm.Chart(df).mark_qq().encode(x="value") -
Hex binning
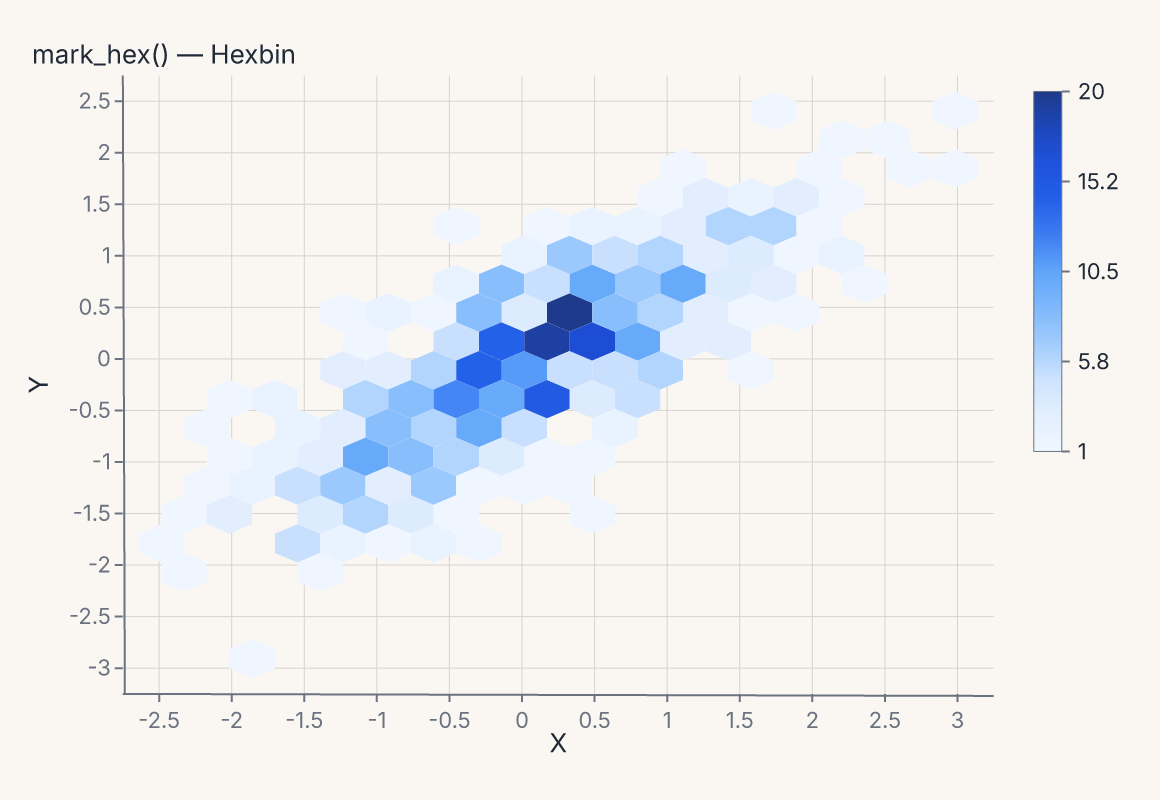
fm.Chart(df).mark_hex().encode(x="x", y="y") -
Raster
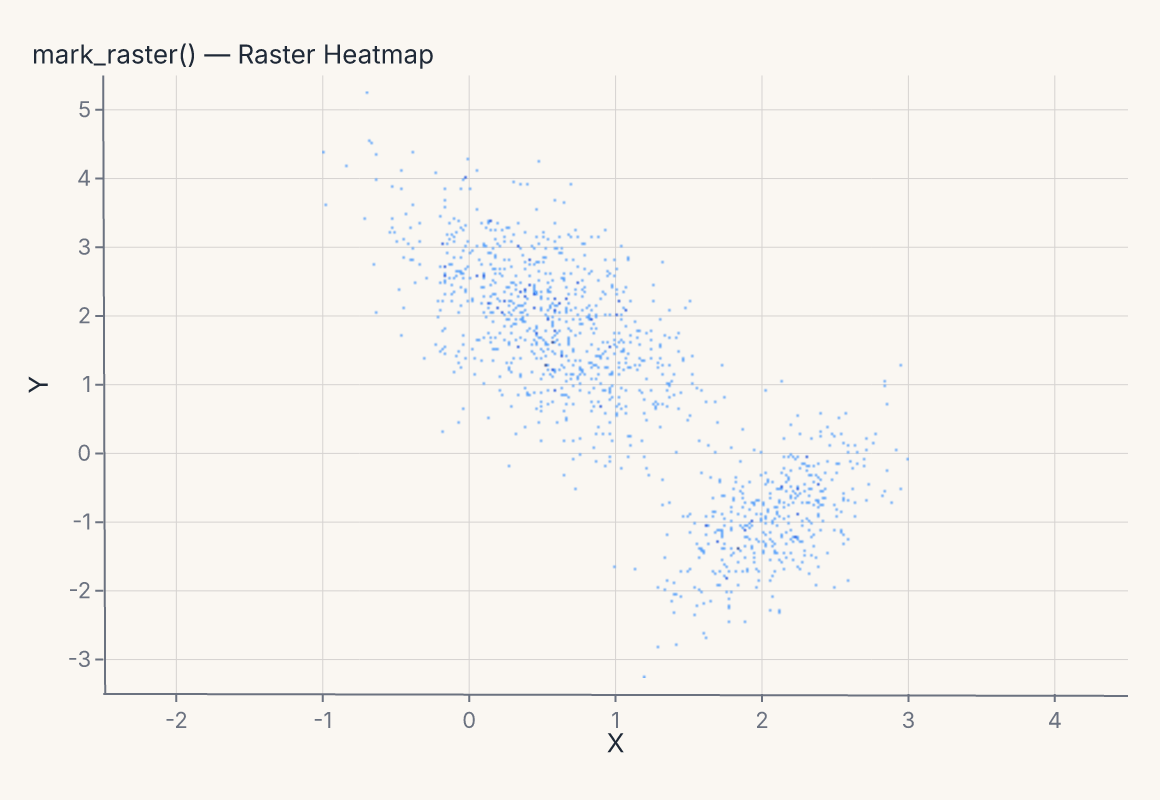
fm.Chart(df).mark_raster().encode(x="x", y="y")
Distribution marks
Summarize distributions across categories.
-
Boxplot
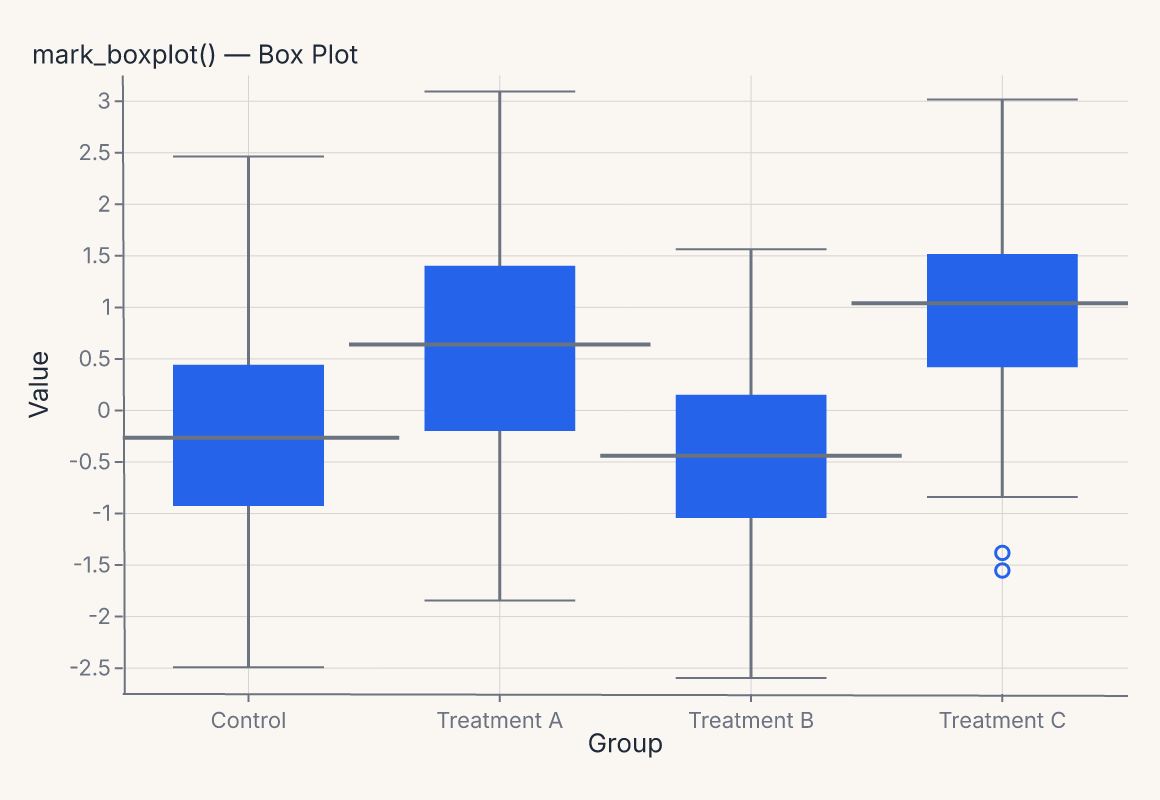
helper:
fm.catplot(df, x="group", y="value", kind="box")grammar:
fm.Chart(df).mark_boxplot().encode(x="group", y="value") -
Boxen (letter-value)
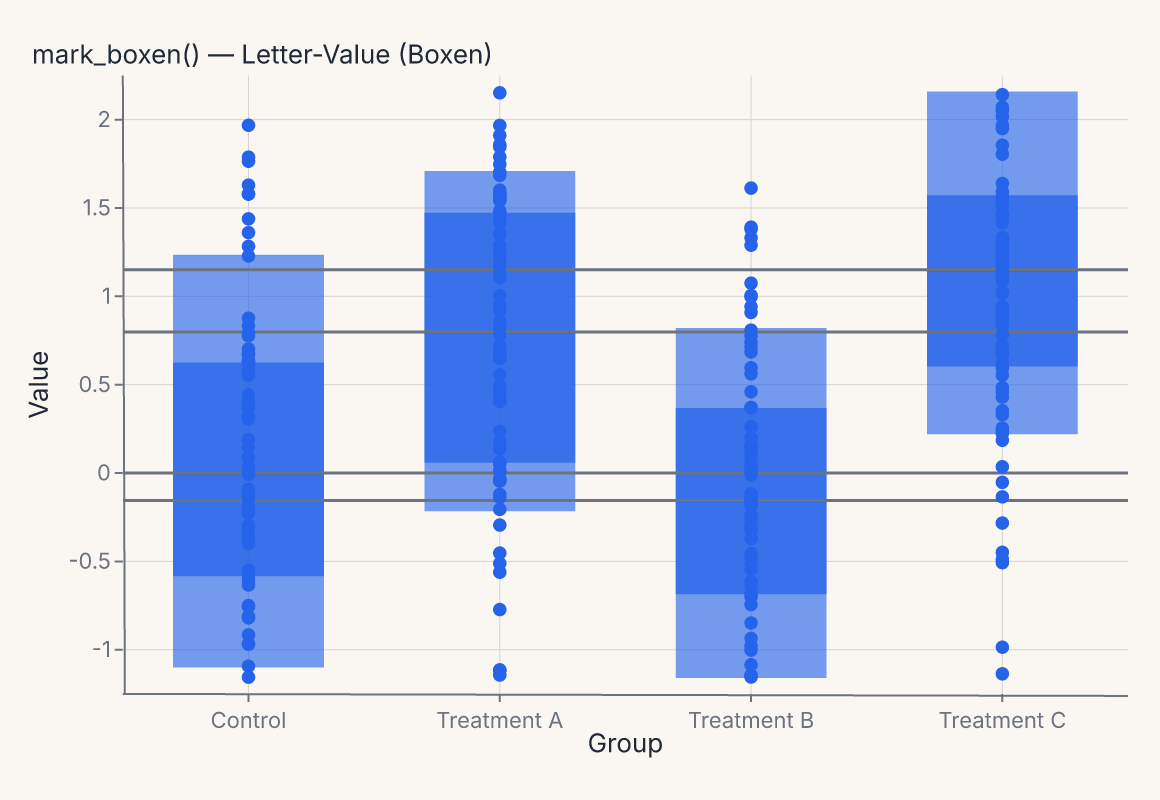
helper:
fm.catplot(df, x="group", y="value", kind="boxen")grammar:
fm.Chart(df).mark_boxen().encode(x="group", y="value") -
Violin
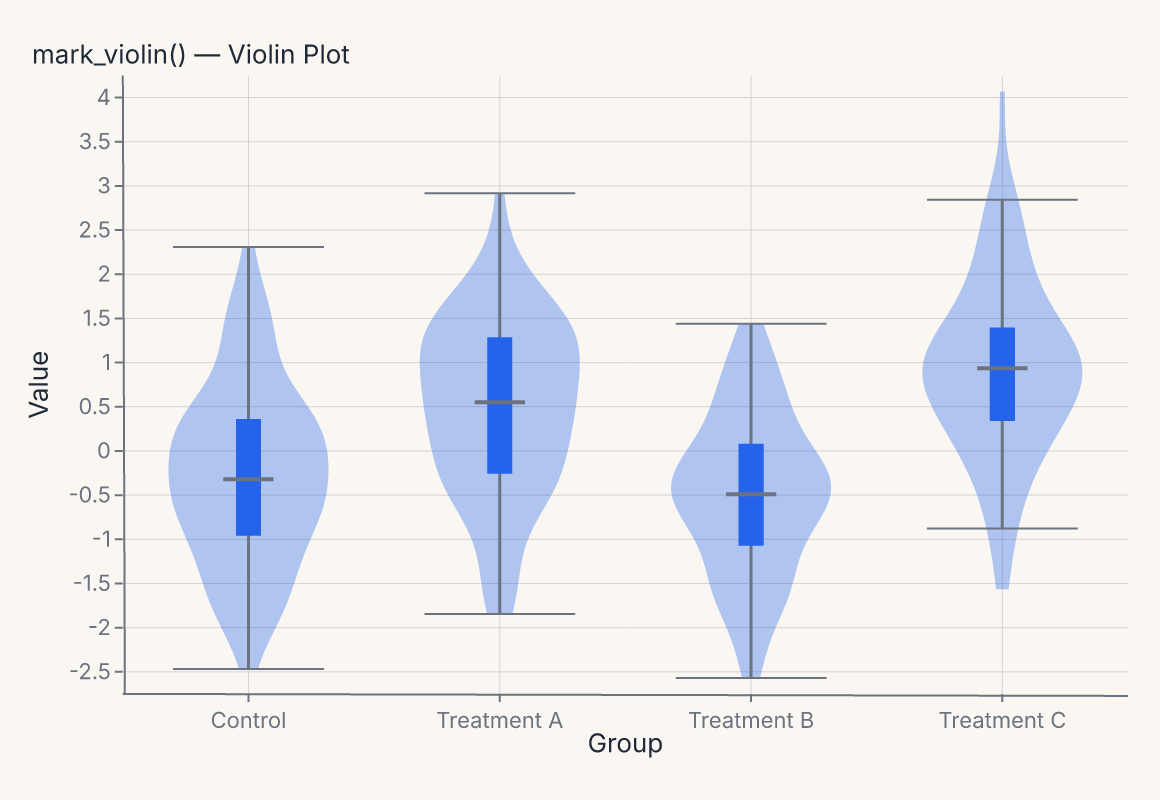
helper:
fm.catplot(df, x="group", y="value", kind="violin")grammar:
fm.Chart(df).mark_violin().encode(x="group", y="value") -
Swarm
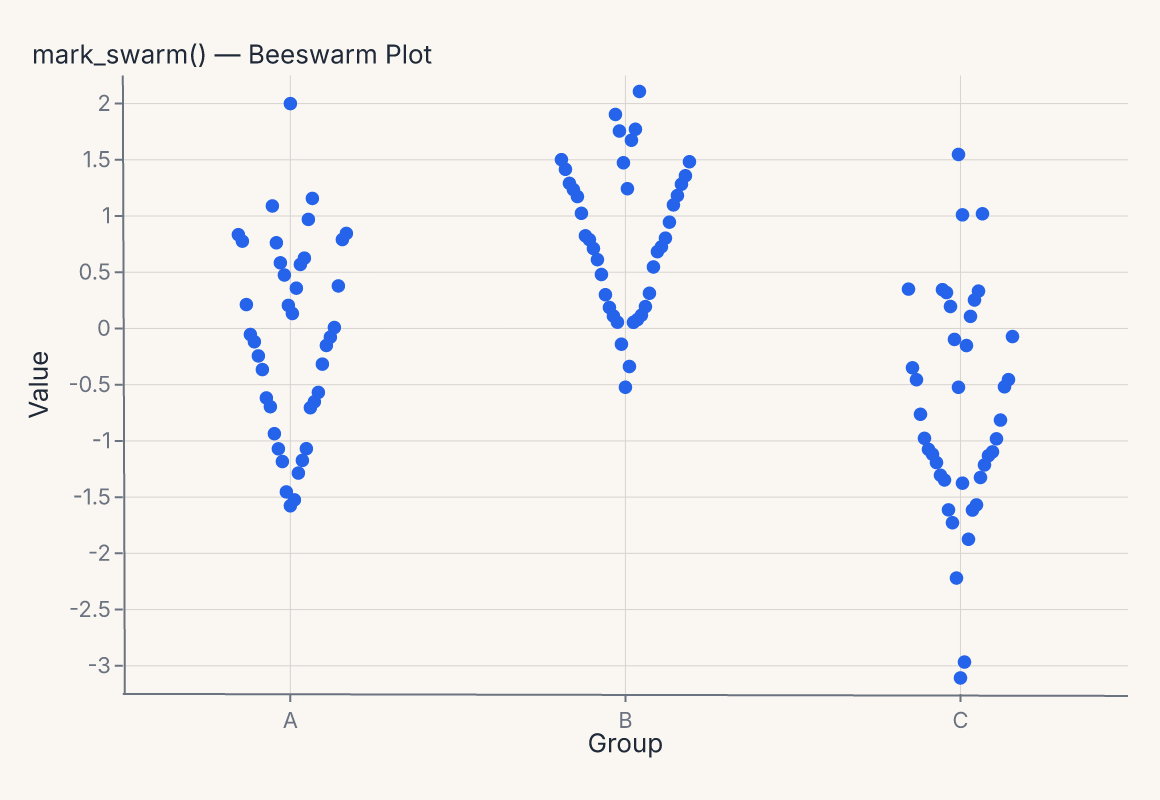
helper:
fm.catplot(df, x="group", y="value", kind="swarm")grammar:
fm.Chart(df).mark_swarm().encode(x="group", y="value")
Uncertainty marks
Show the spread around an estimate.
-
Error bar
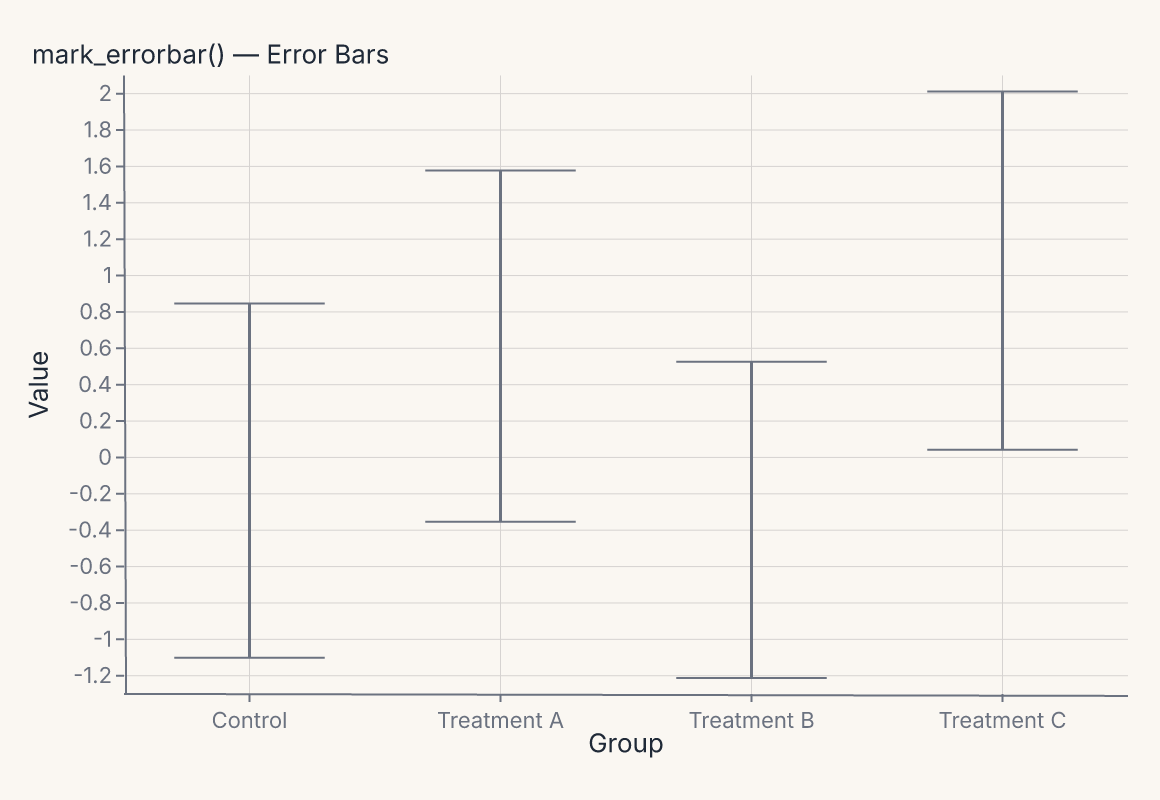
fm.Chart(df).mark_errorbar(extent="stdev").encode(x="group", y="value") -
Ribbon

fm.Chart(df).mark_ribbon().encode(x="x", y="lower", y2="upper")
Composition
Multiple marks and charts combined into compound views.
-
Scatter + smooth + CI
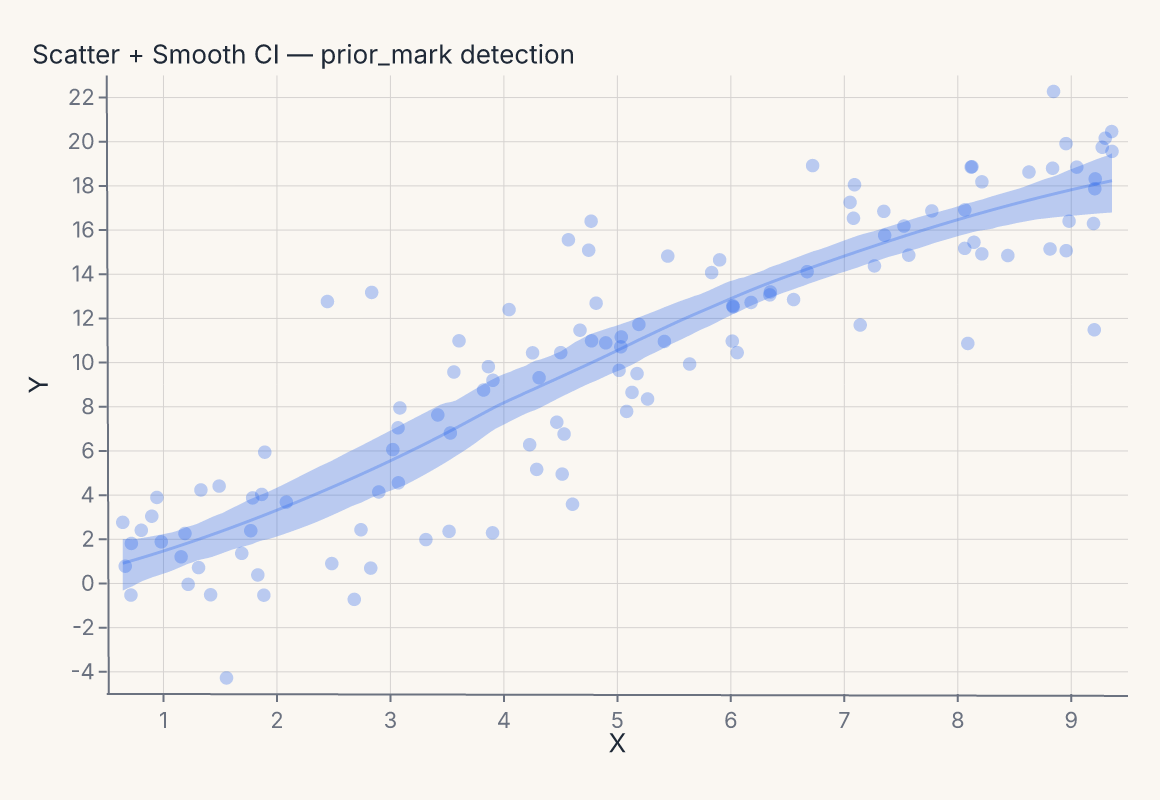
fm.Chart(df).mark_point(opacity=0.3).mark_smooth(ci=0.95).encode(x="x", y="y") -
Histogram + density overlay
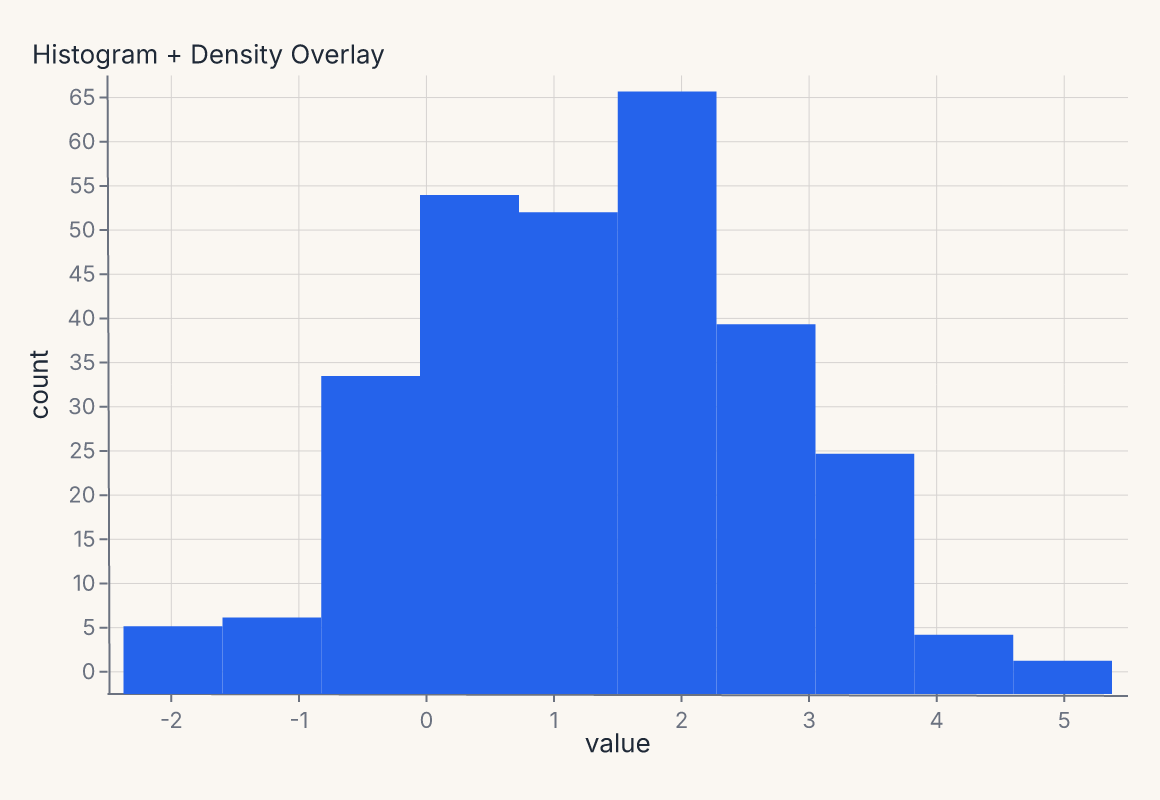
fm.Chart(df).mark_histogram() + fm.Chart(df).mark_density() -
Line + ribbon
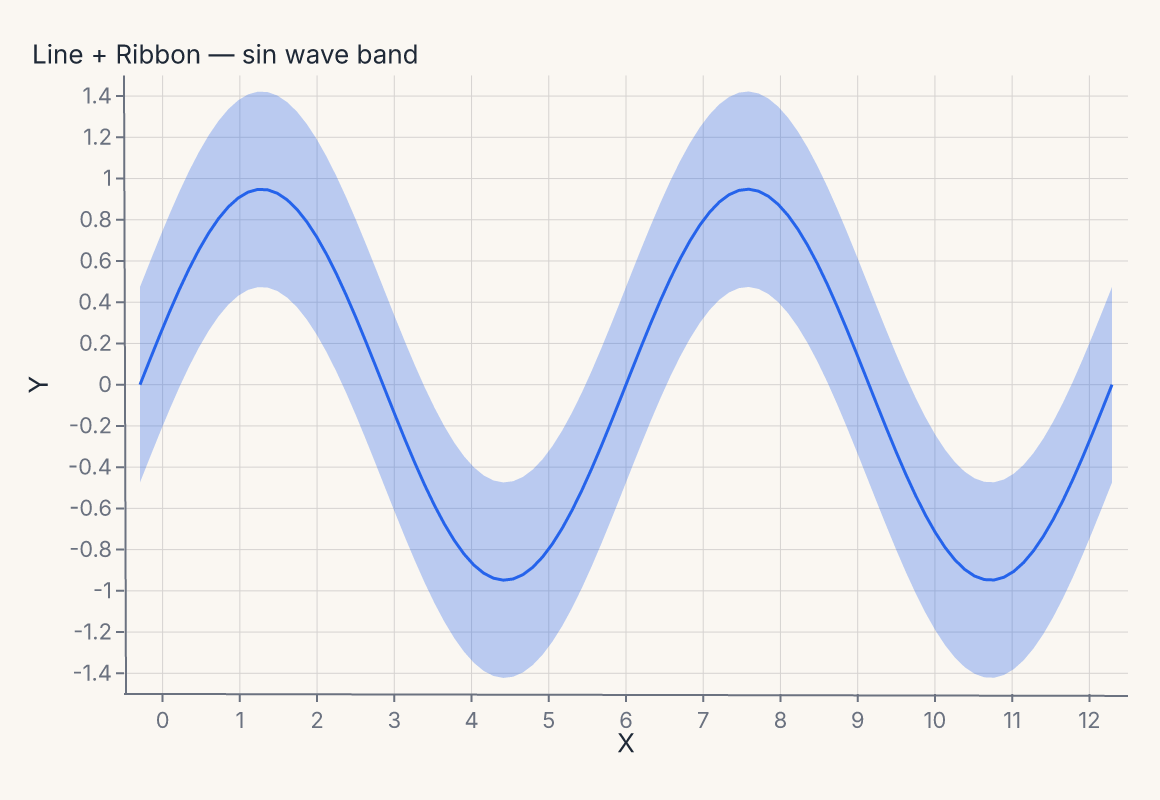
fm.Chart(df).mark_ribbon().encode(x="x", y="lower", y2="upper") + fm.Chart(df).mark_line() -
Boxplot + swarm
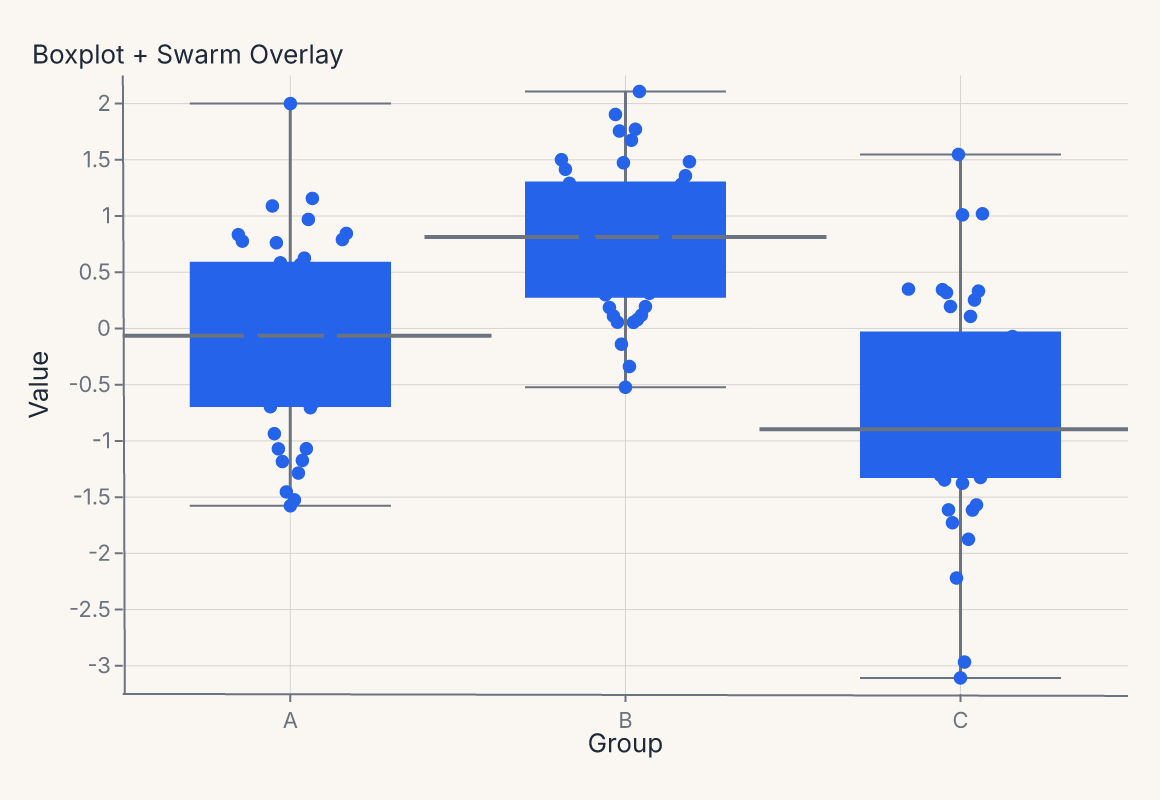
fm.Chart(df).mark_boxplot() + fm.Chart(df).mark_swarm() -
Dodged bar + error bar
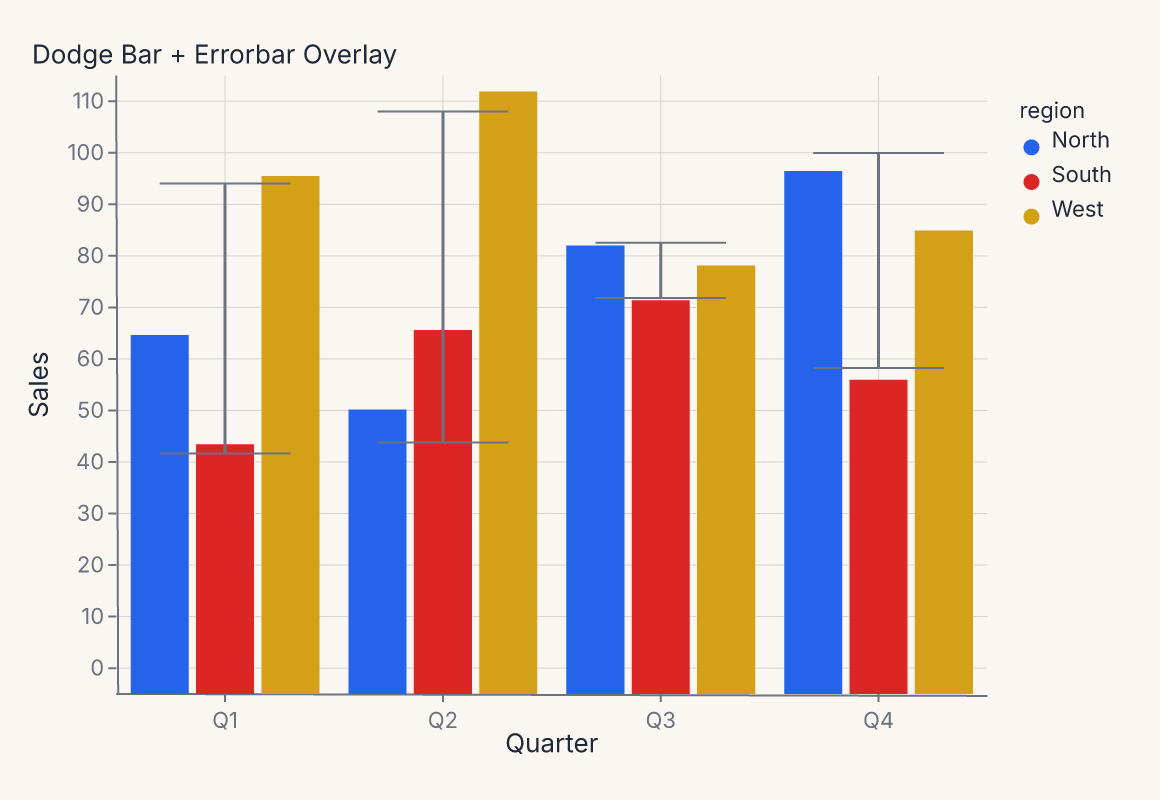
fm.Chart(df).mark_bar(position=fm.Dodge()) + fm.Chart(df).mark_errorbar() -
Grouped smooth
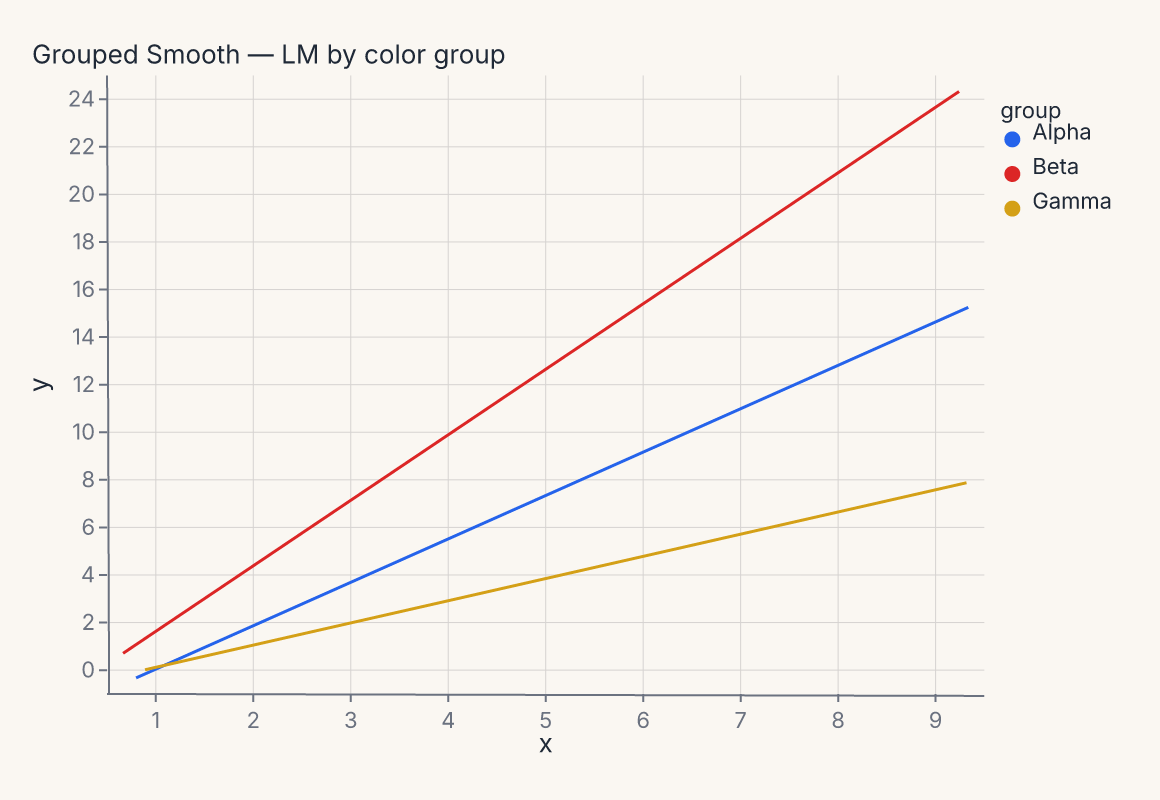
fm.Chart(df).mark_smooth(method="lm", groupby="group").encode(x="x", y="y", color="group") -
Faceted smooth
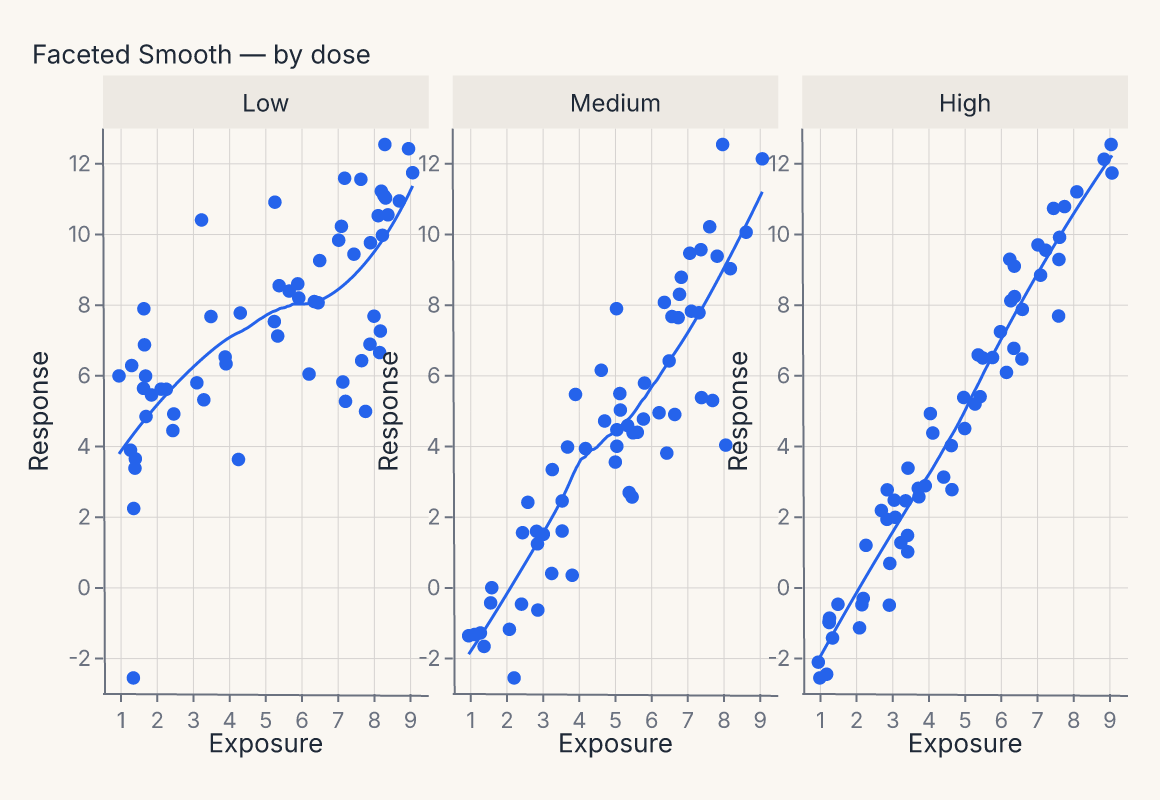
fm.Chart(df).mark_point().mark_smooth(groupby="dose").encode(...).facet(col="dose") -
Horizontal concat
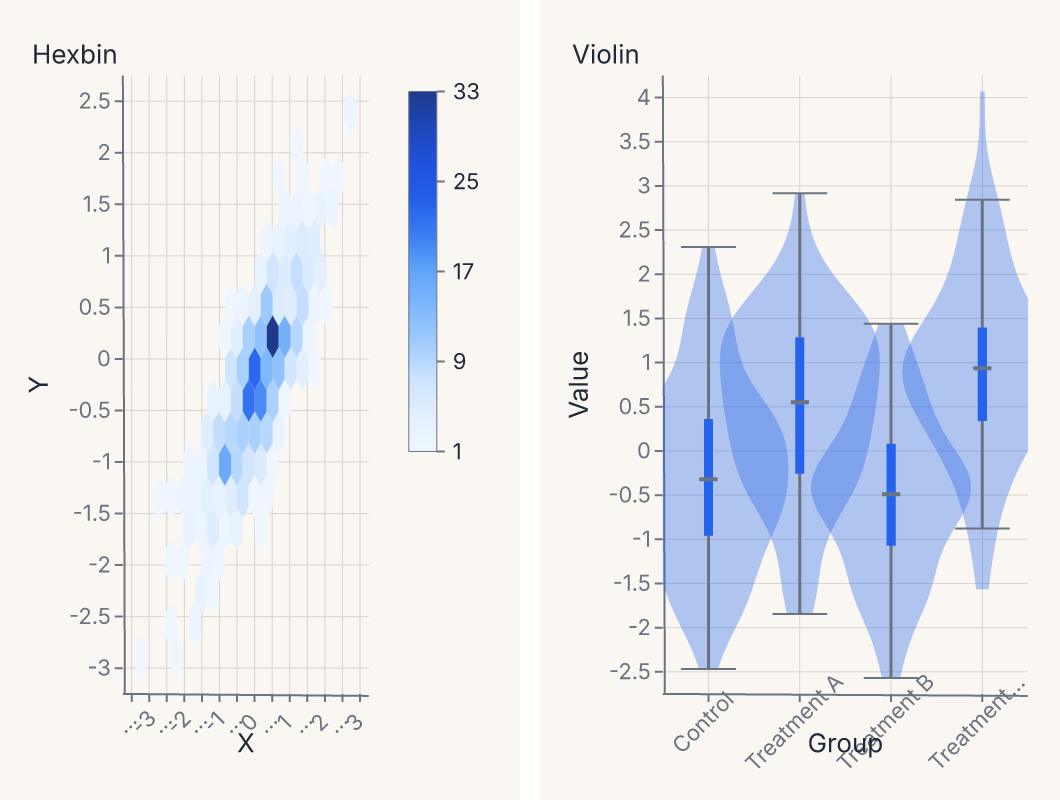
fm.hconcat(chart_hex, chart_violin)
Figure-level helpers
One-line entry points for common chart patterns.
-
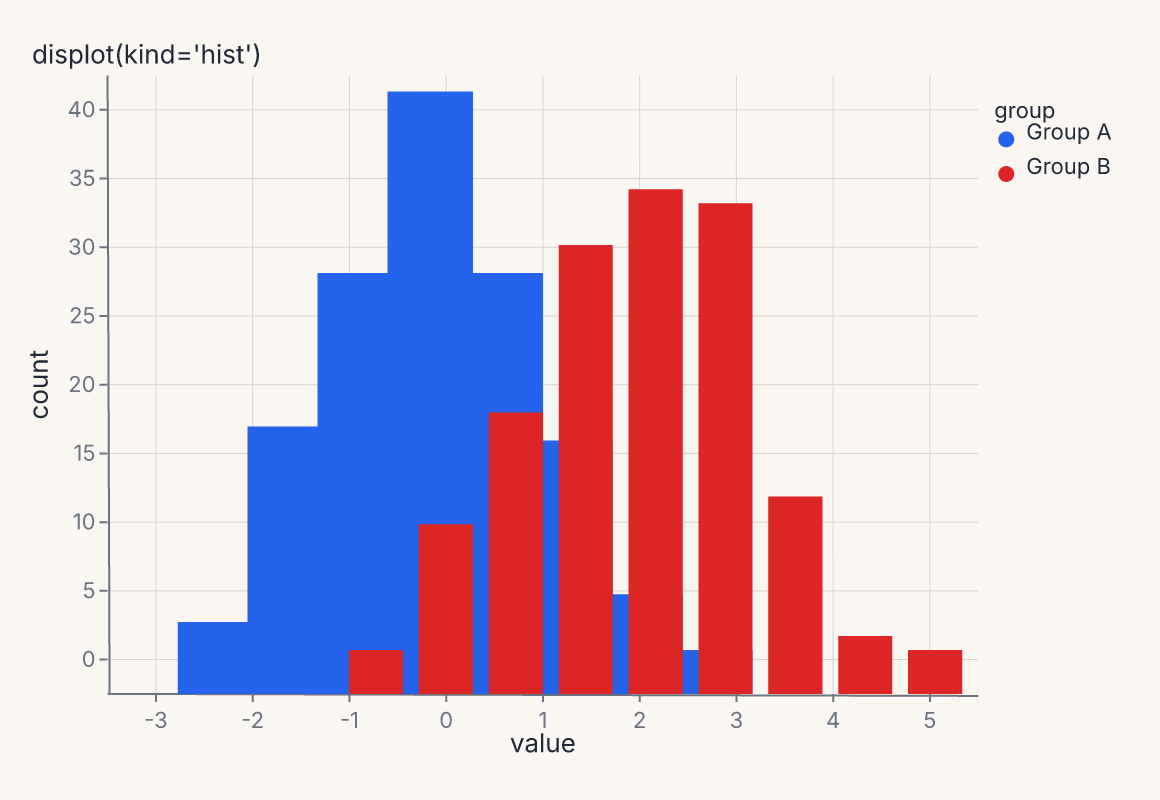
displot (histogram)
helper:
fm.displot(df, x="value", hue="group", kind="hist")grammar:
fm.Chart(df).mark_histogram(groupby="group").encode(x="value", color="group") -
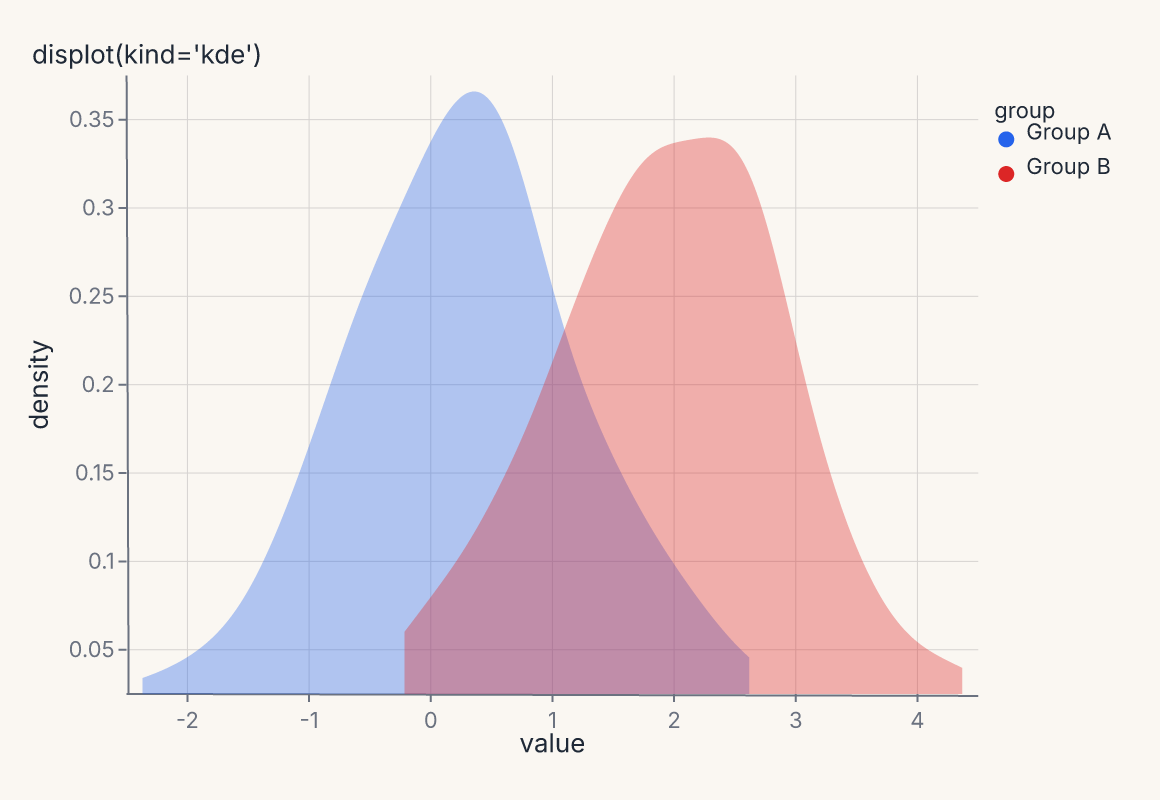
displot (KDE)
helper:
fm.displot(df, x="value", hue="group", kind="kde")grammar:
fm.Chart(df).mark_density(groupby="group").encode(x="value", color="group") -
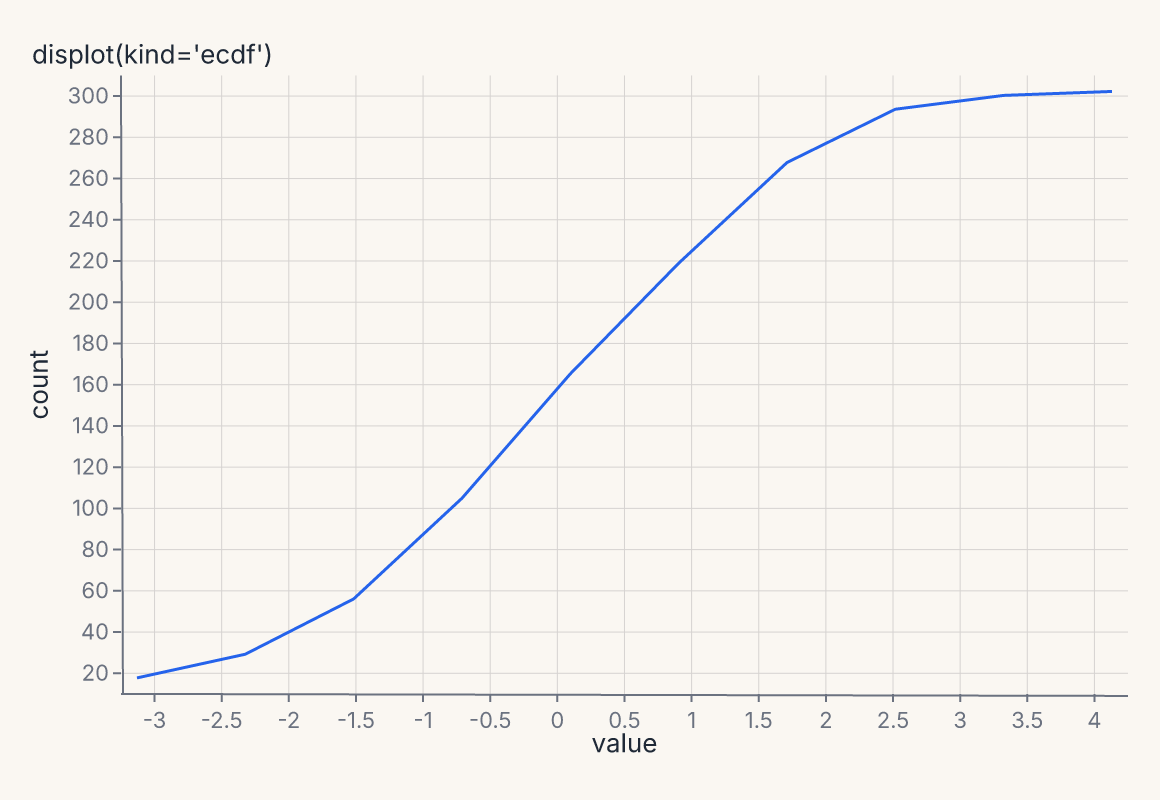
displot (ECDF)
helper:
fm.displot(df, x="value", kind="ecdf") -
catplot (box)
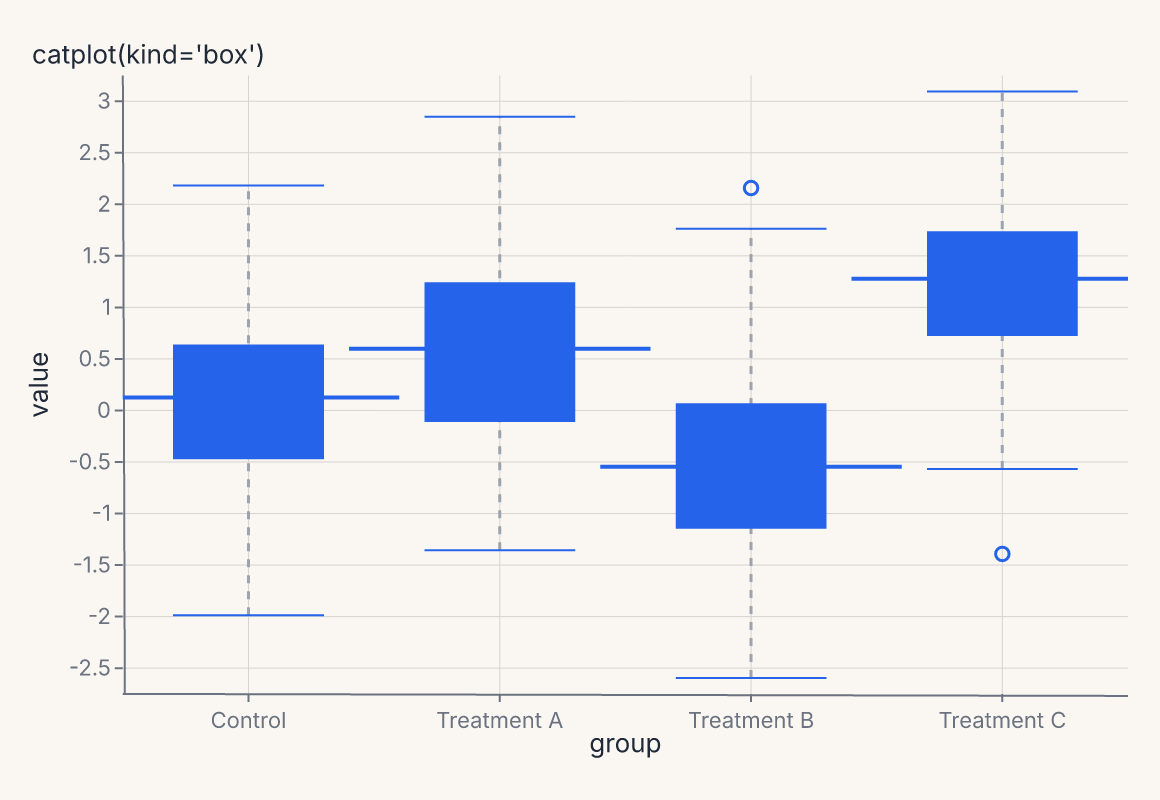
helper:
fm.catplot(df, x="group", y="value", kind="box")grammar:
fm.Chart(df).mark_boxplot().encode(x="group", y="value") -
catplot (violin)
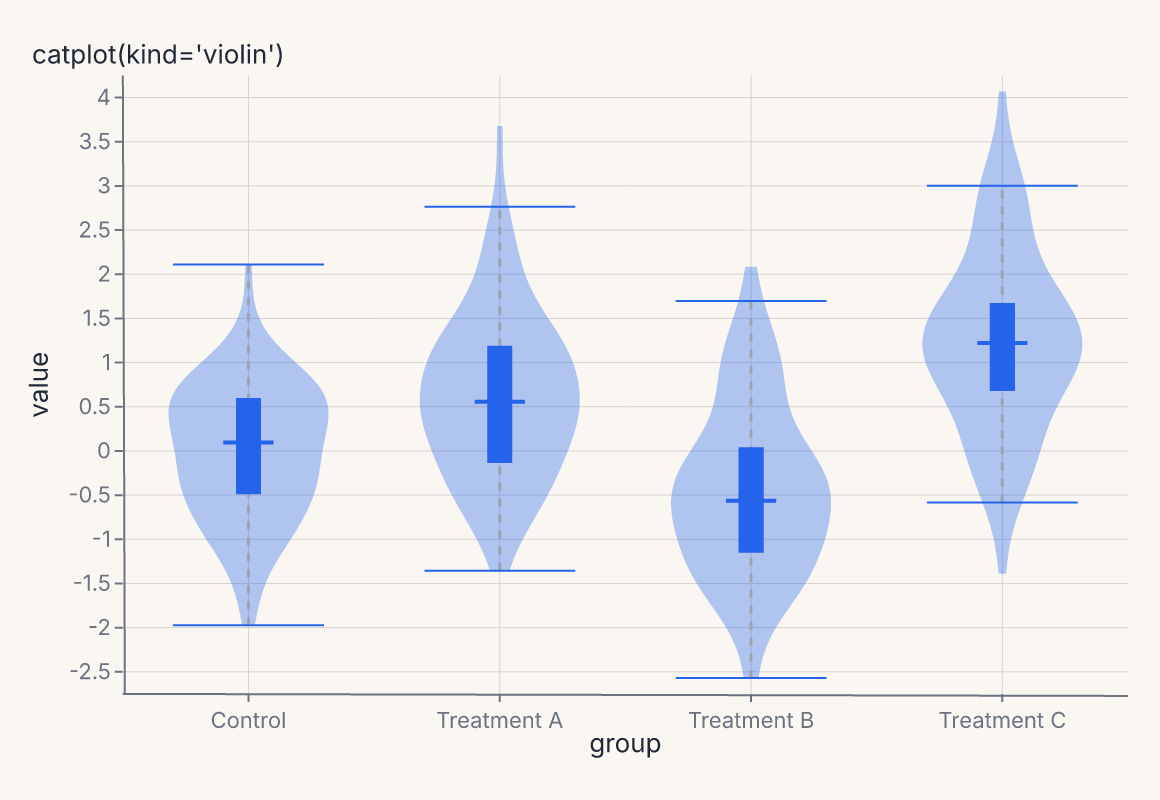
helper:
fm.catplot(df, x="group", y="value", kind="violin")grammar:
fm.Chart(df).mark_violin().encode(x="group", y="value") -
catplot (strip)
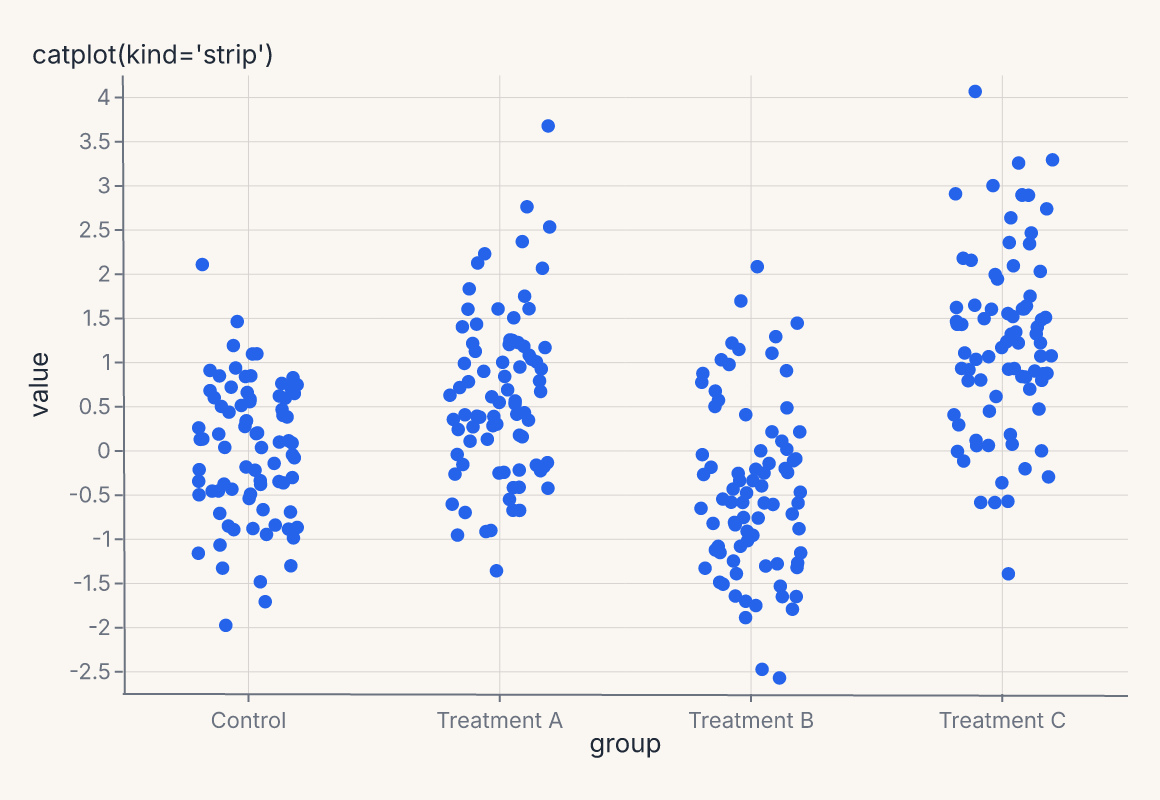
helper:
fm.catplot(df, x="group", y="value", kind="strip")grammar:
fm.Chart(df).mark_point().encode(x="group", y="value") -
lmplot
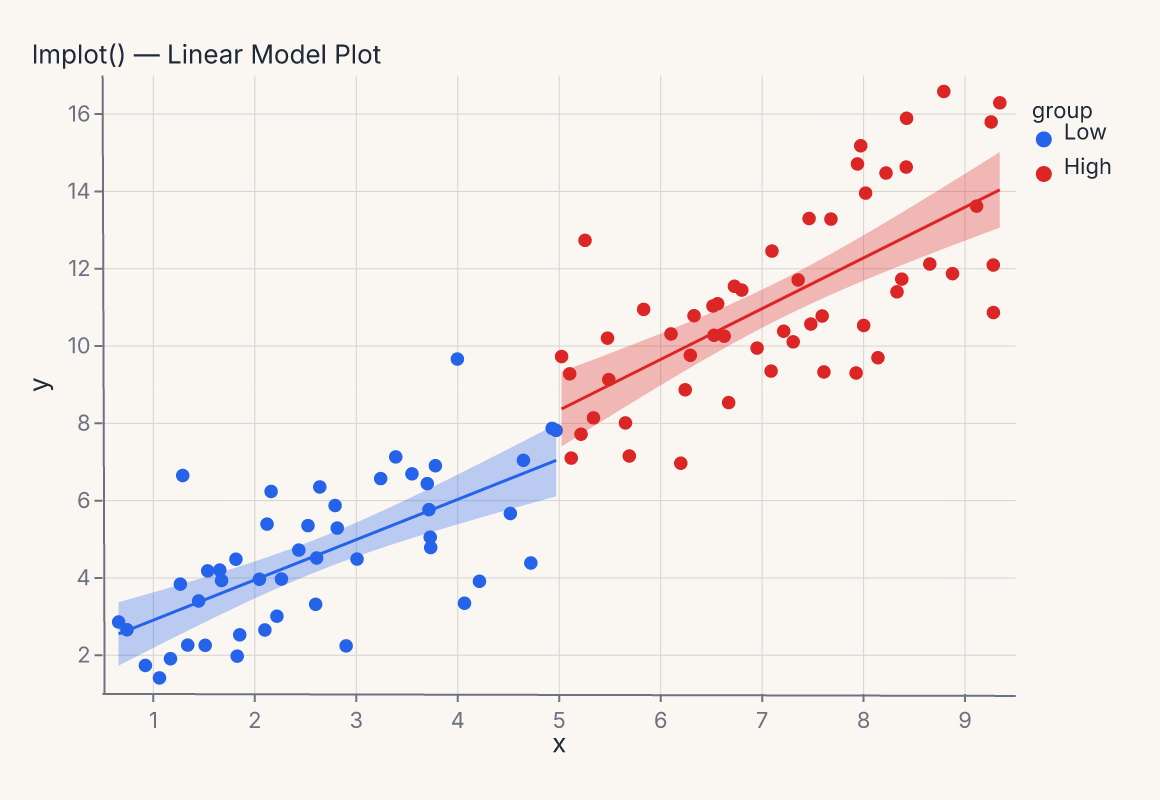
helper:
fm.lmplot(df, x="x", y="y", hue="group")grammar:
fm.Chart(df).mark_point().encode(...) + fm.Chart(df).mark_smooth(method="lm") -
residplot
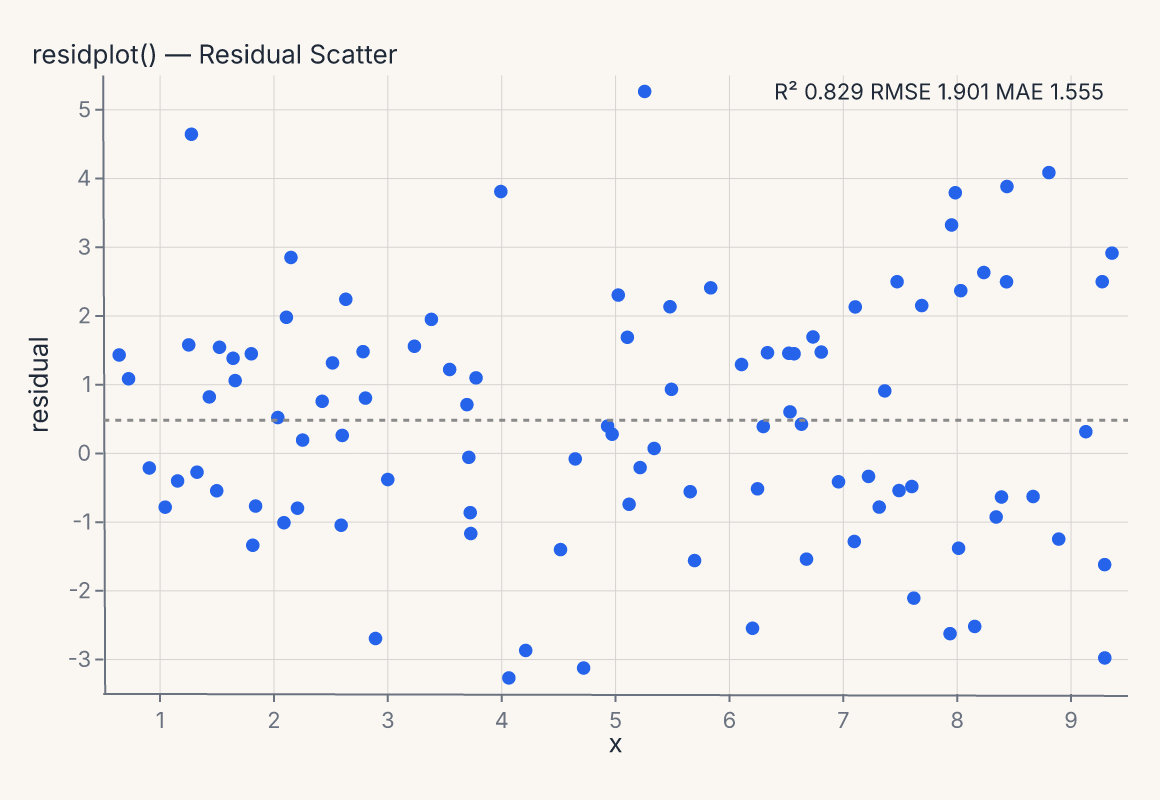
helper:
fm.residplot(df, x="x", y="y")grammar:
fm.Chart(df).mark_smooth(method="lm", inject_residuals=True).encode(x="x", y="residual") -
pairplot
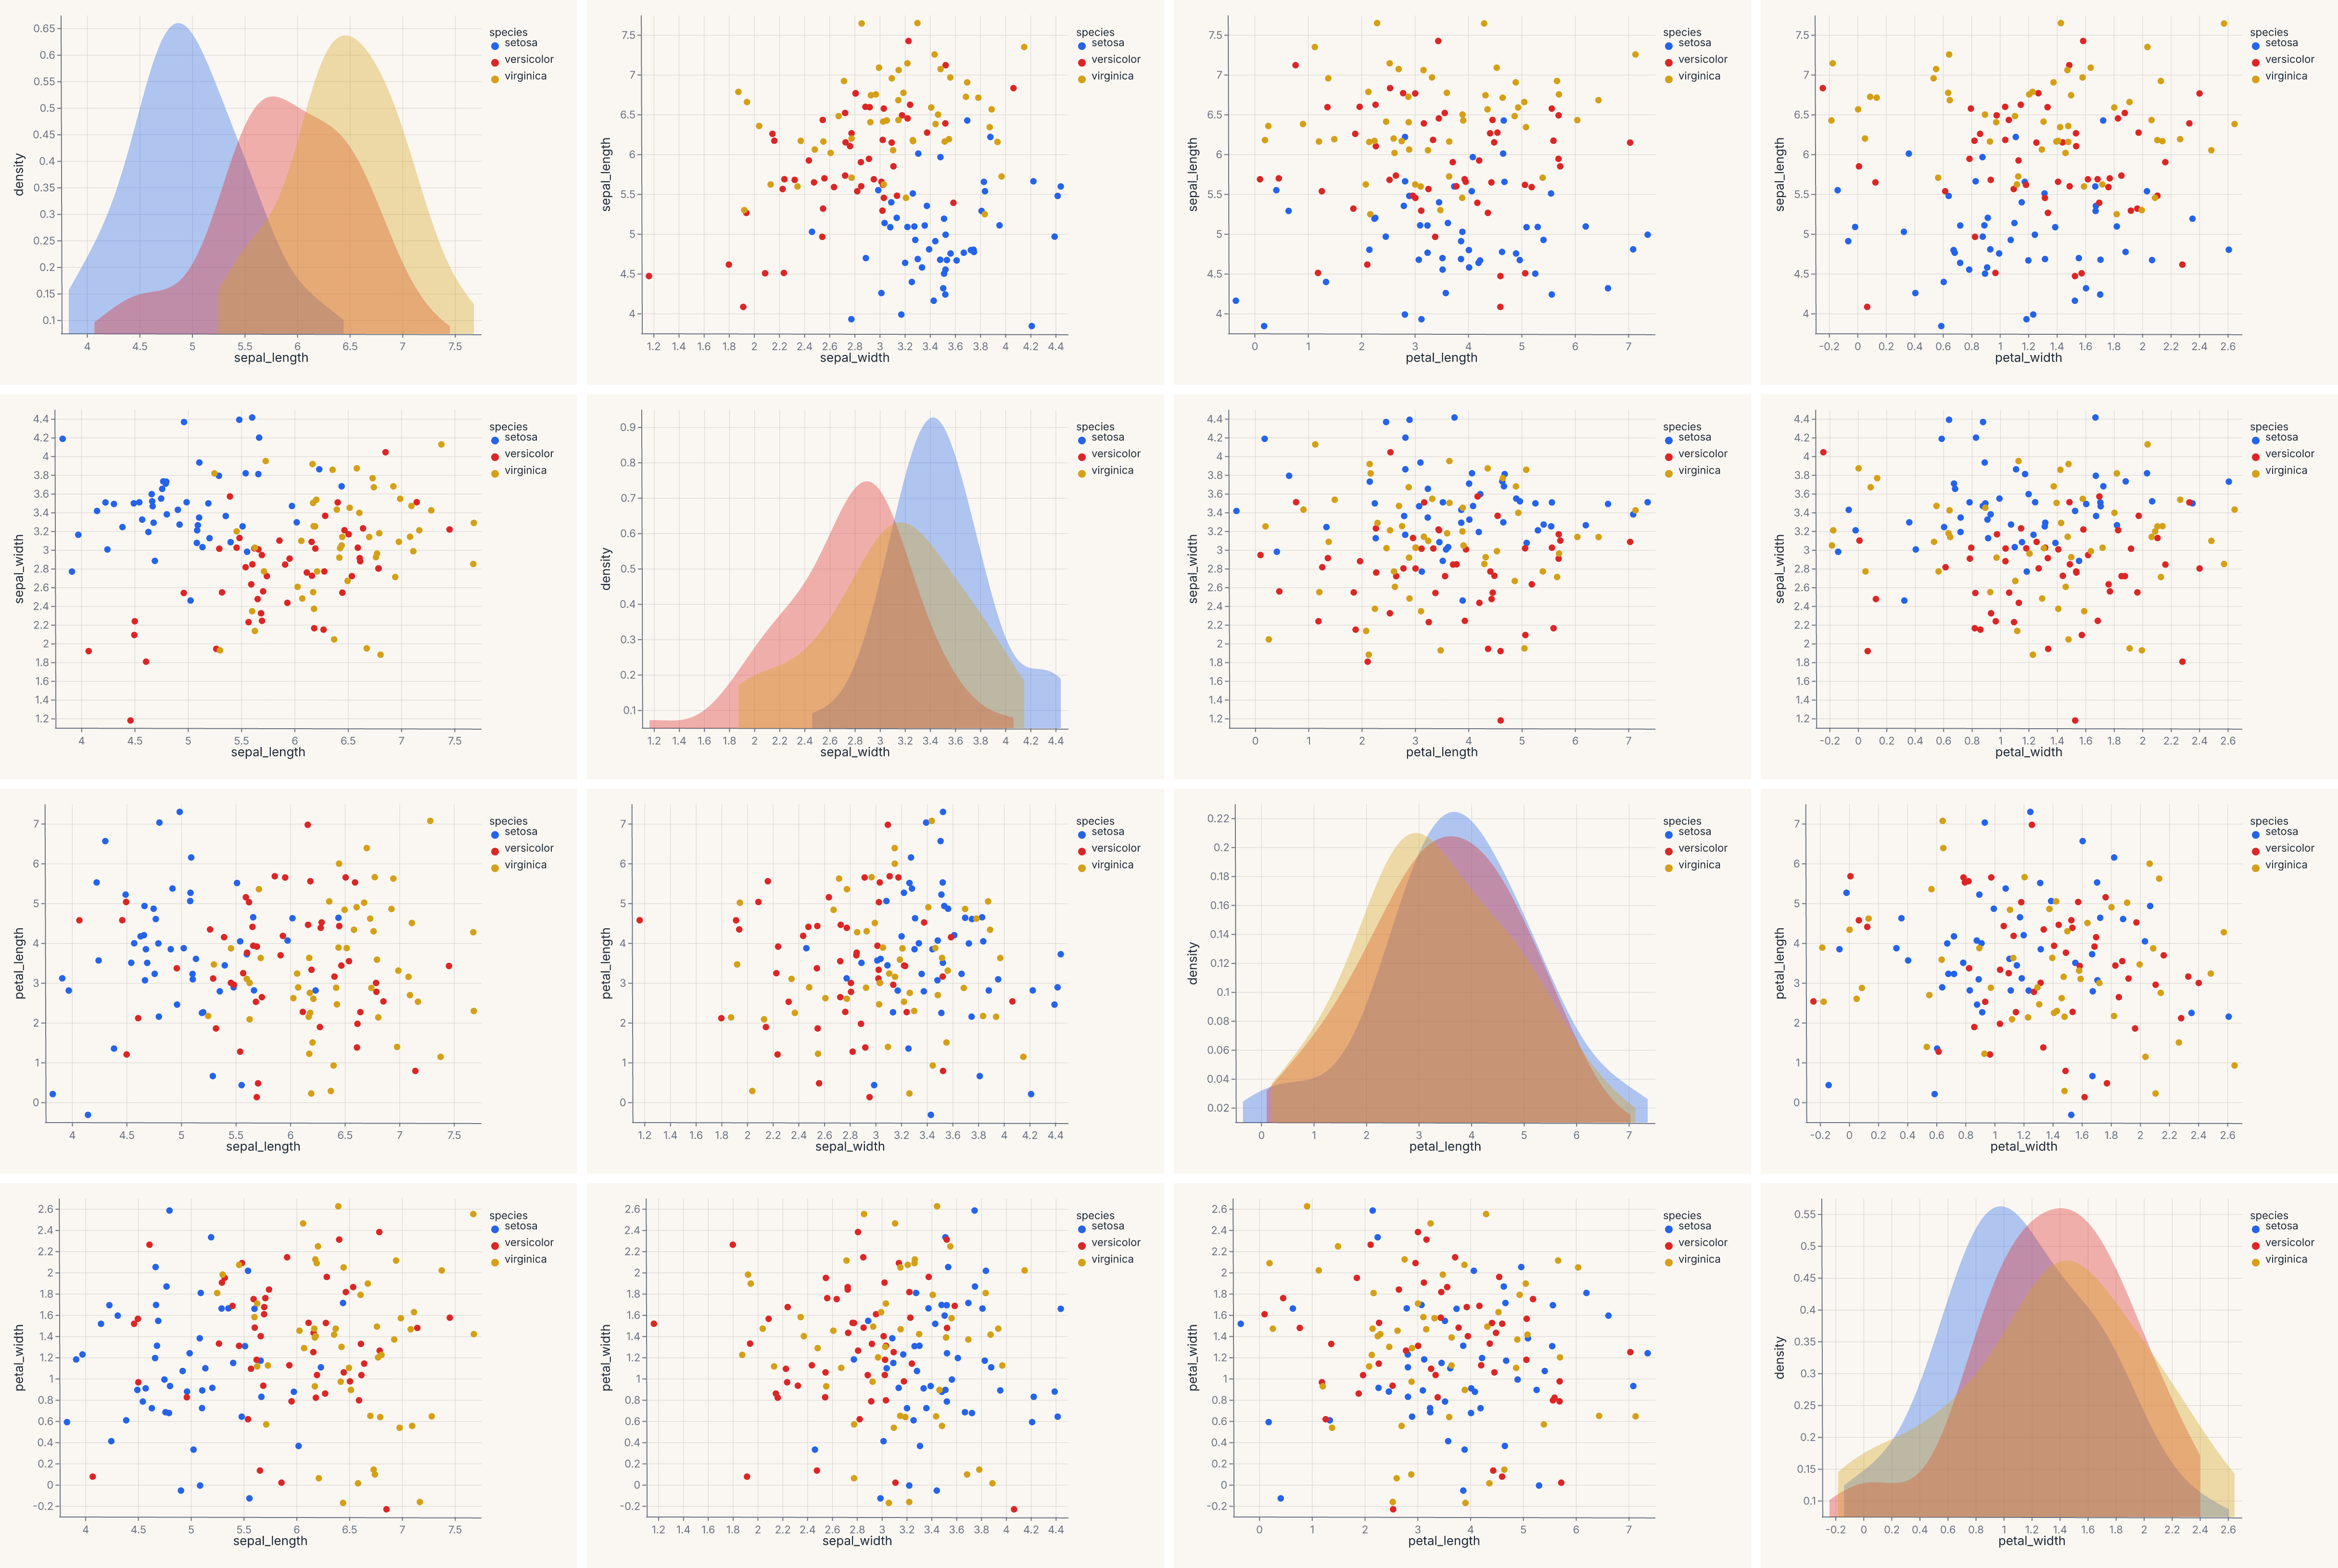
helper:
fm.pairplot(df, vars=[...], hue="species")grammar:
fm.RepeatChart(template, row=[...], column=[...]) -
jointplot
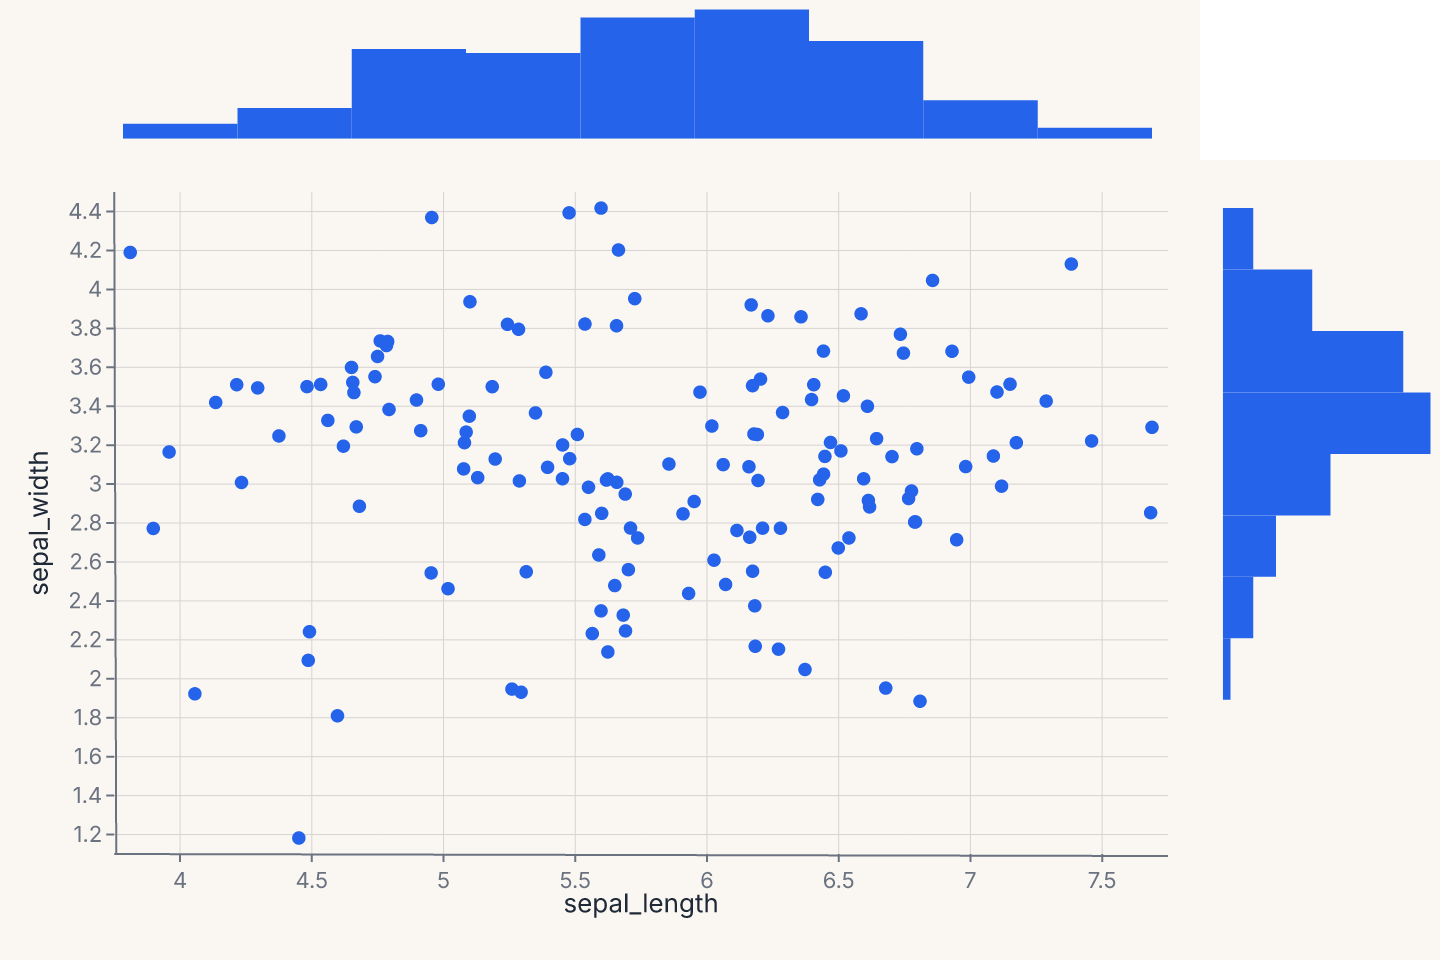
helper:
fm.jointplot(df, x="sepal_length", y="sepal_width")grammar:
fm.JointChart(center, top=marginal) -
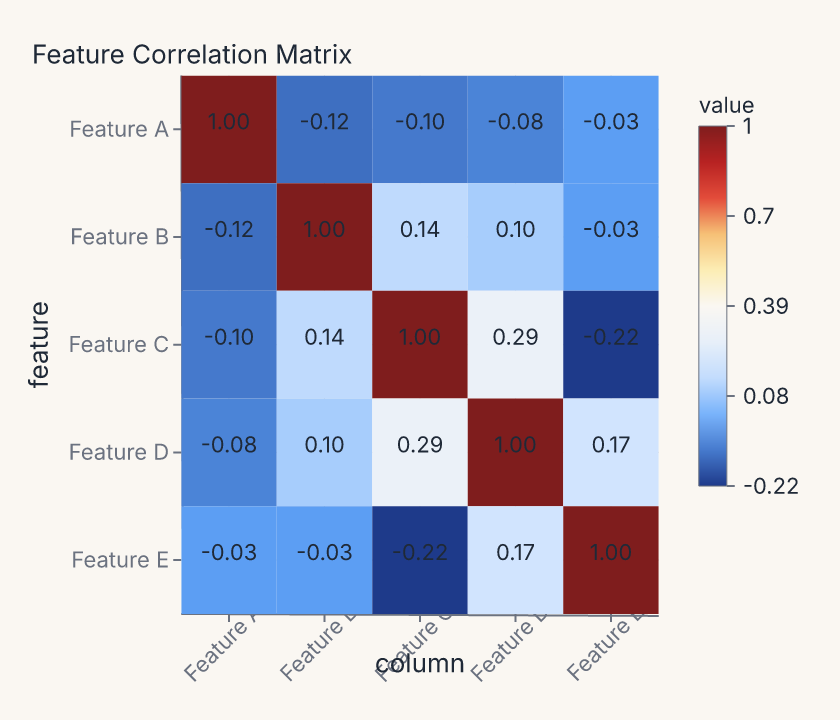
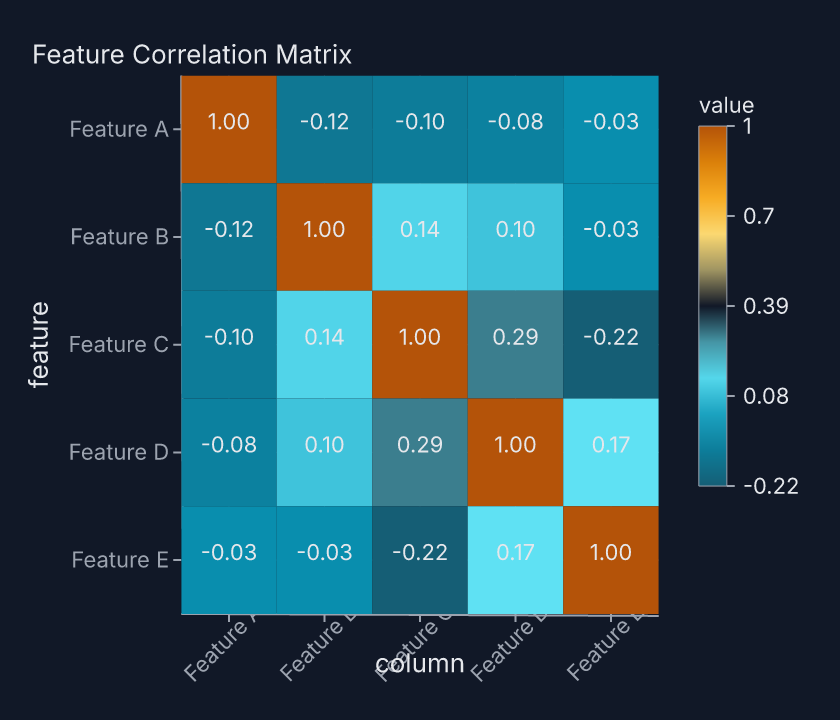
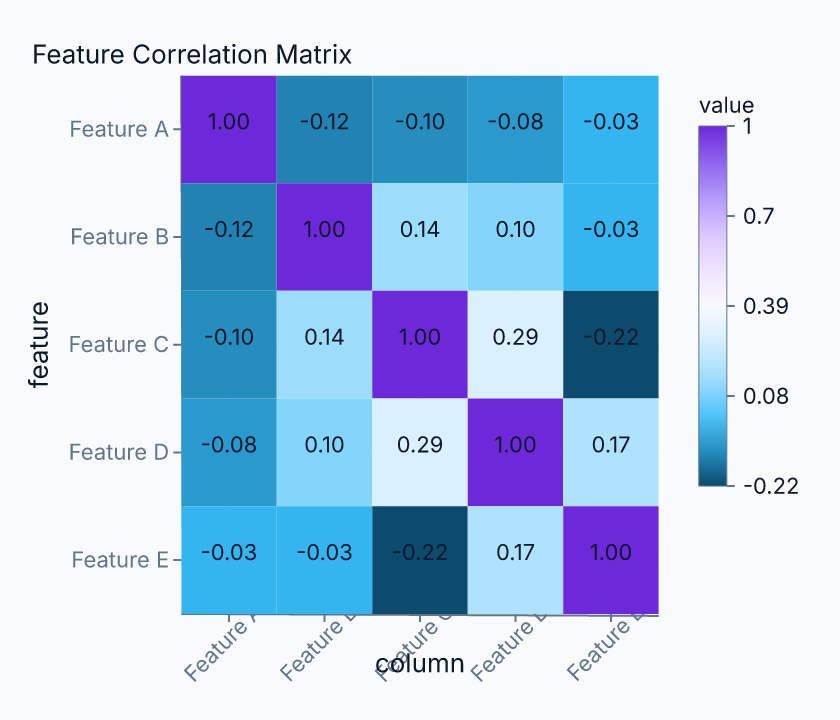
heatmap
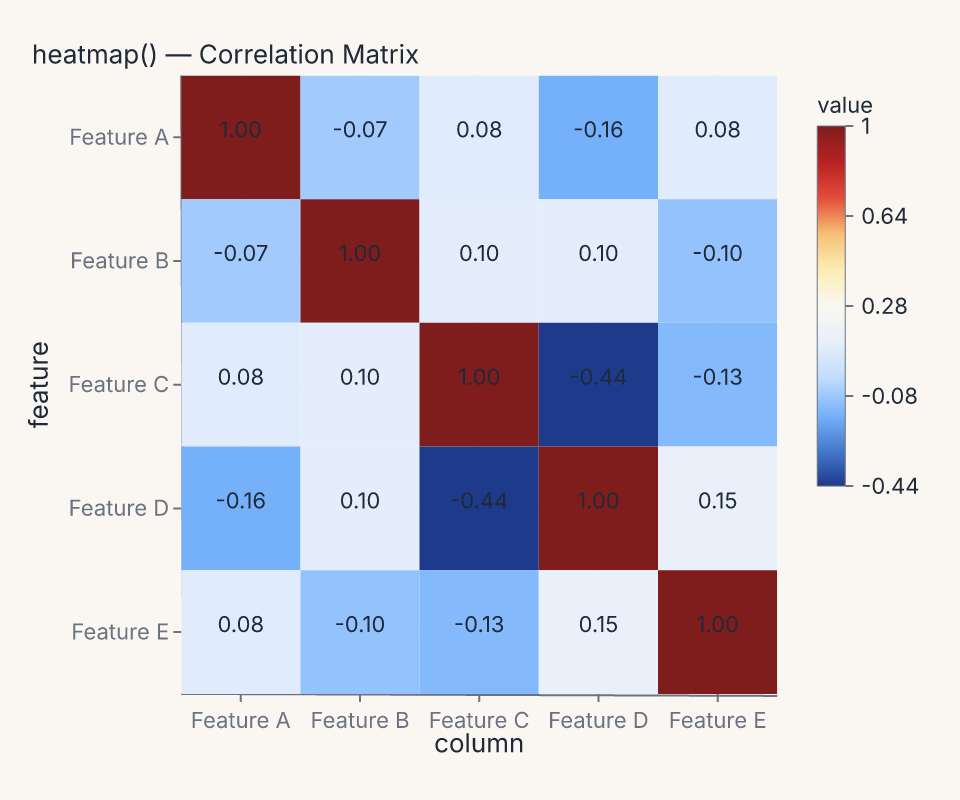
helper:
fm.heatmap(df_corr, center=0, annot=True)grammar:
fm.Chart(df).mark_rect().encode(x="col", y="row", color="value") -
clustermap
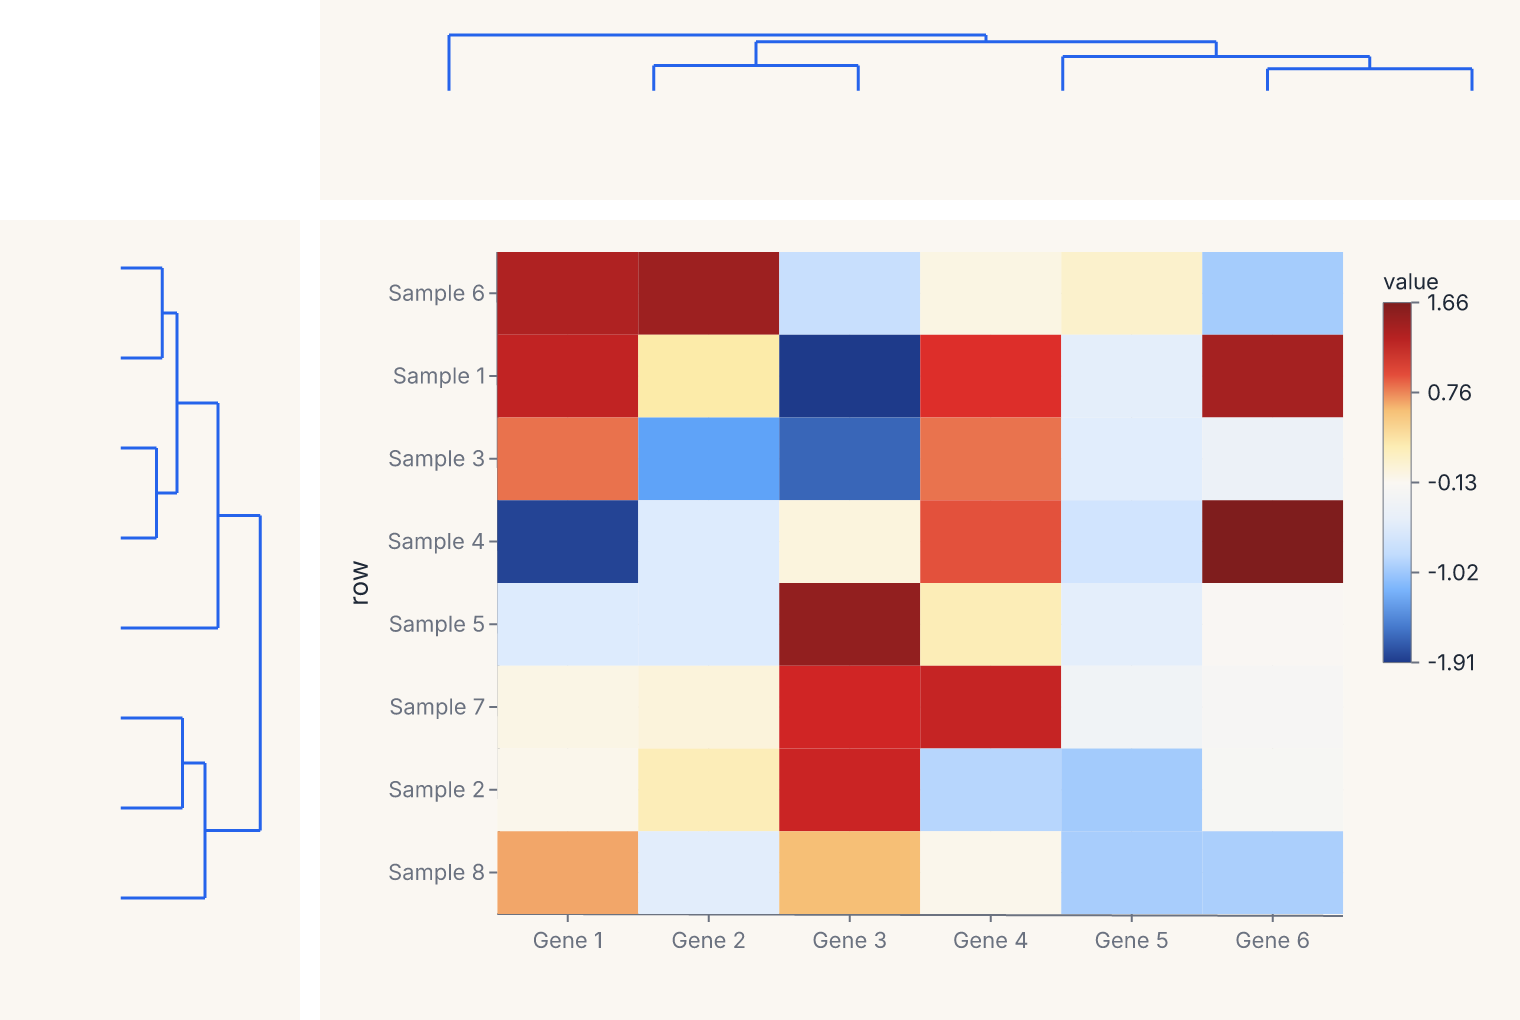
helper:
fm.clustermap(df_cluster)grammar:
fm.ClusterMapChart(heatmap, row_dendrogram, col_dendrogram)
Model diagnostics
Classification, regression, feature explanation, model selection, and clustering — all as charts.
-
ROC curve
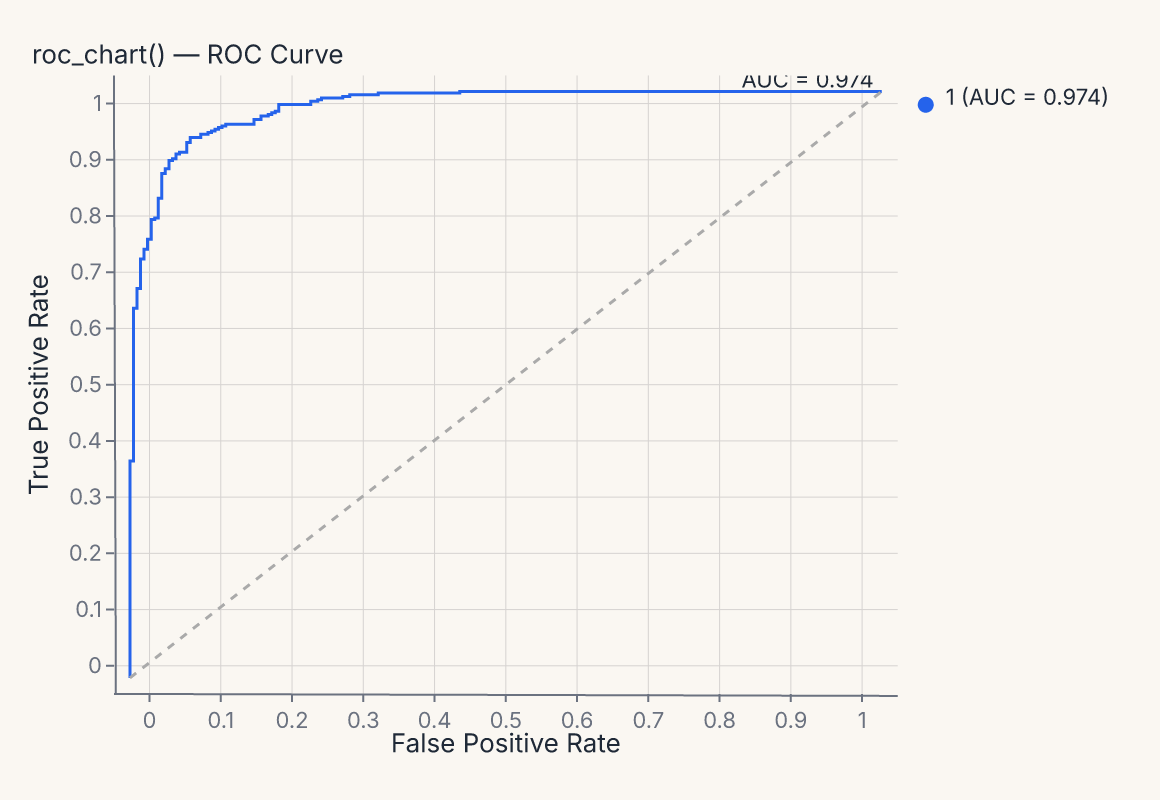
fm.roc_chart(model, X_test, y_test) -
Precision-recall
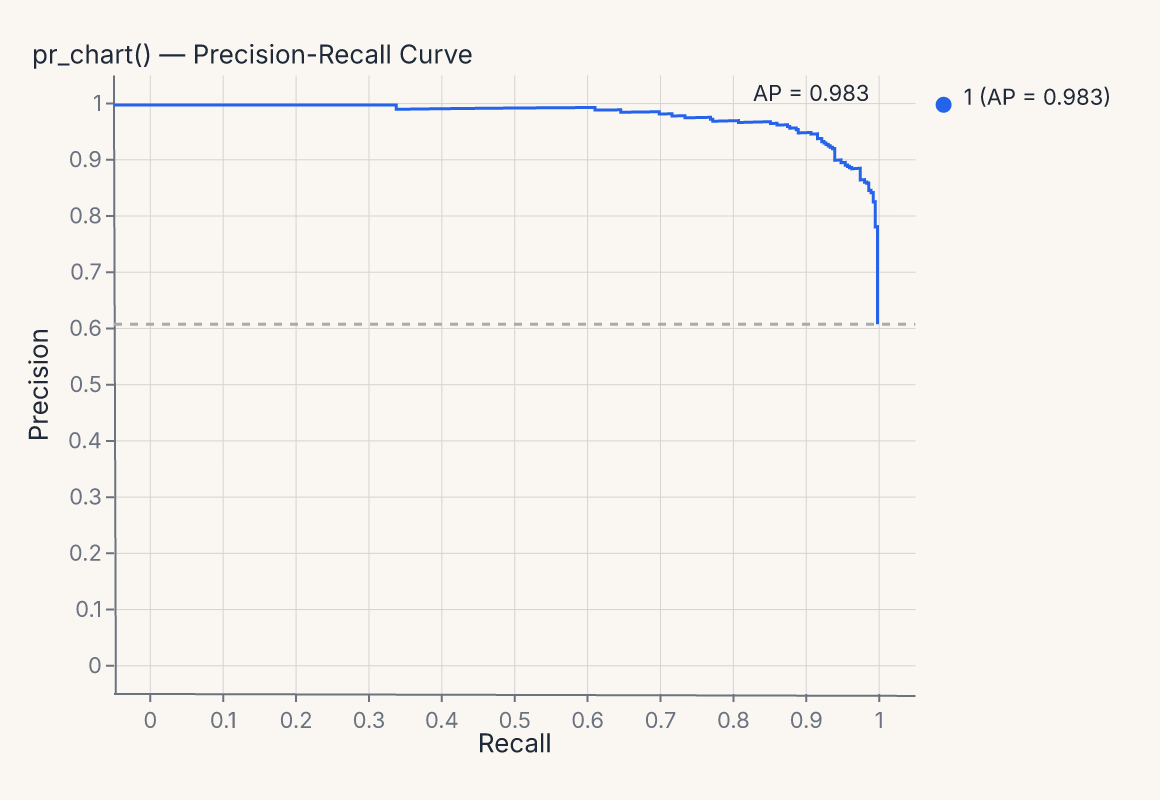
fm.pr_chart(model, X_test, y_test) -
Confusion matrix
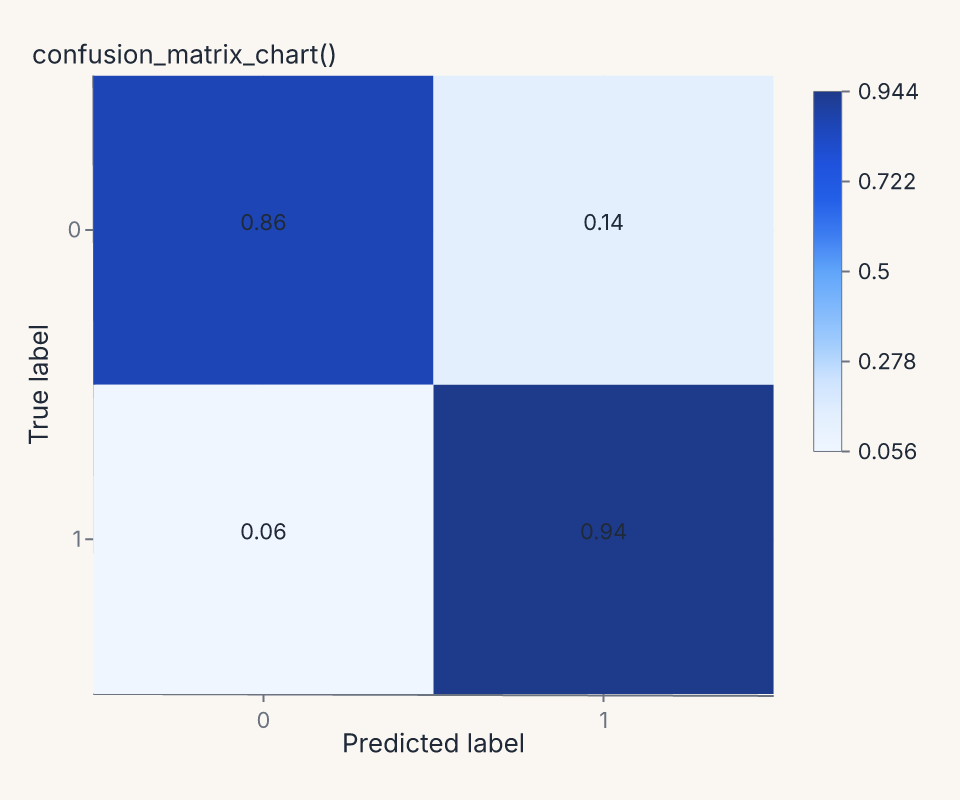
fm.confusion_matrix_chart(model, X_test, y_test) -
Class prediction error
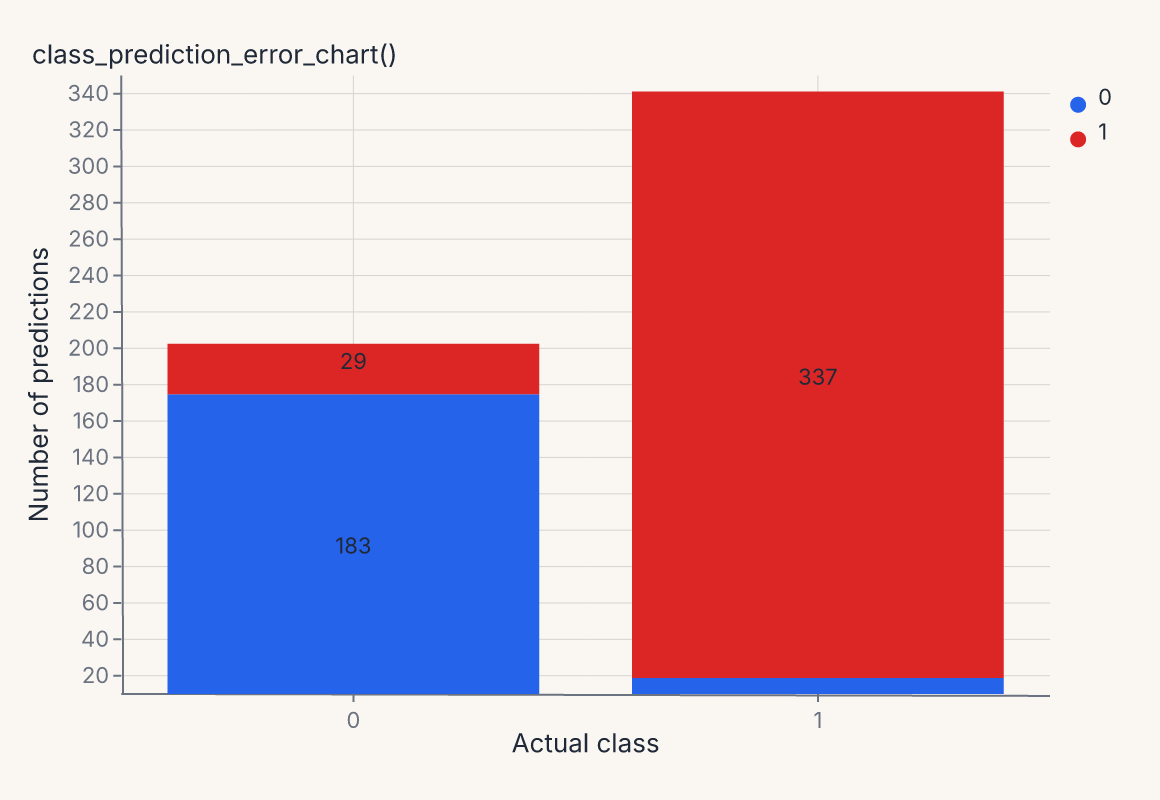
fm.class_prediction_error_chart(model, X_test, y_test) -
Discrimination threshold
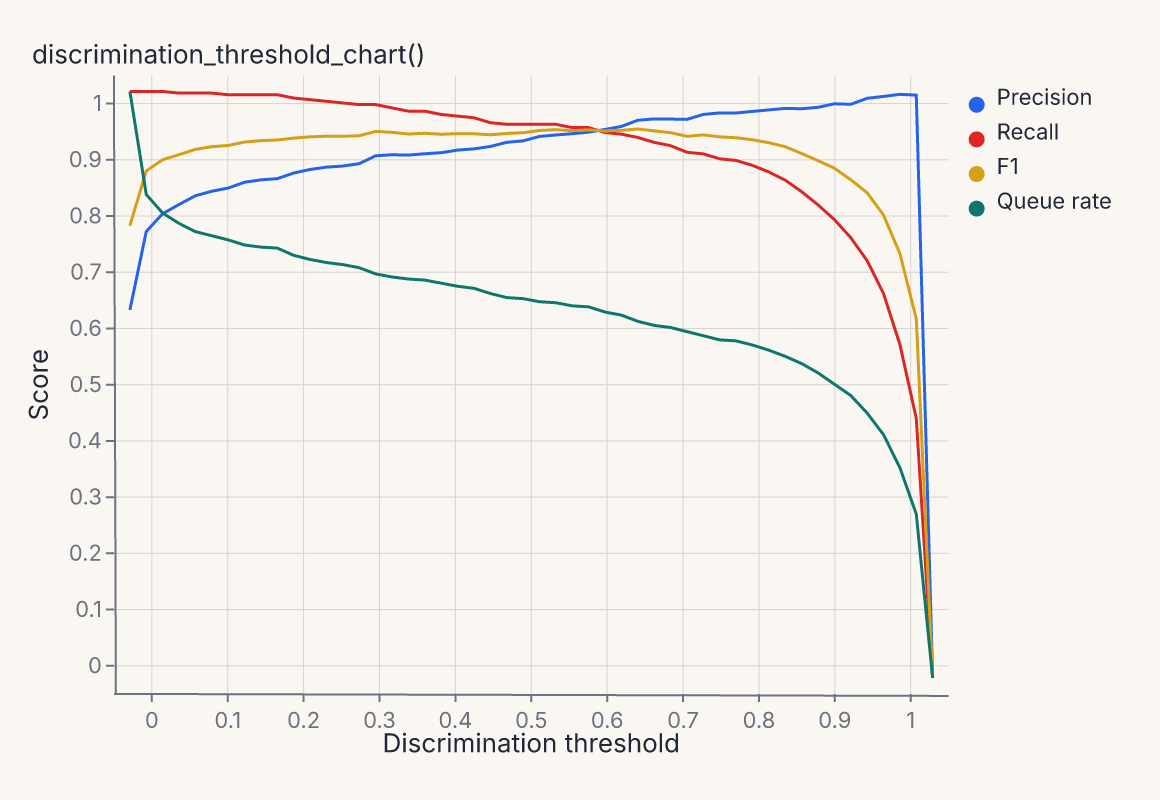
fm.discrimination_threshold_chart(model, X_test, y_test) -
Gain chart
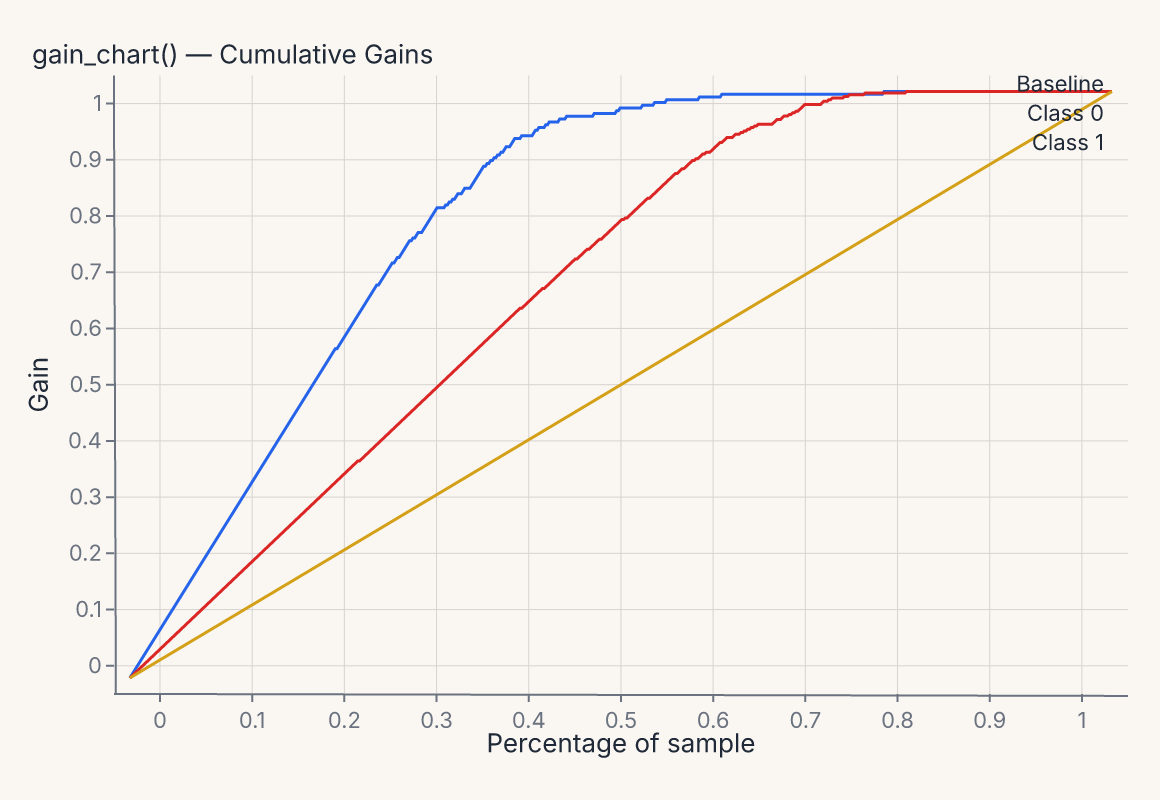
fm.gain_chart(model, X_test, y_test) -
Lift chart
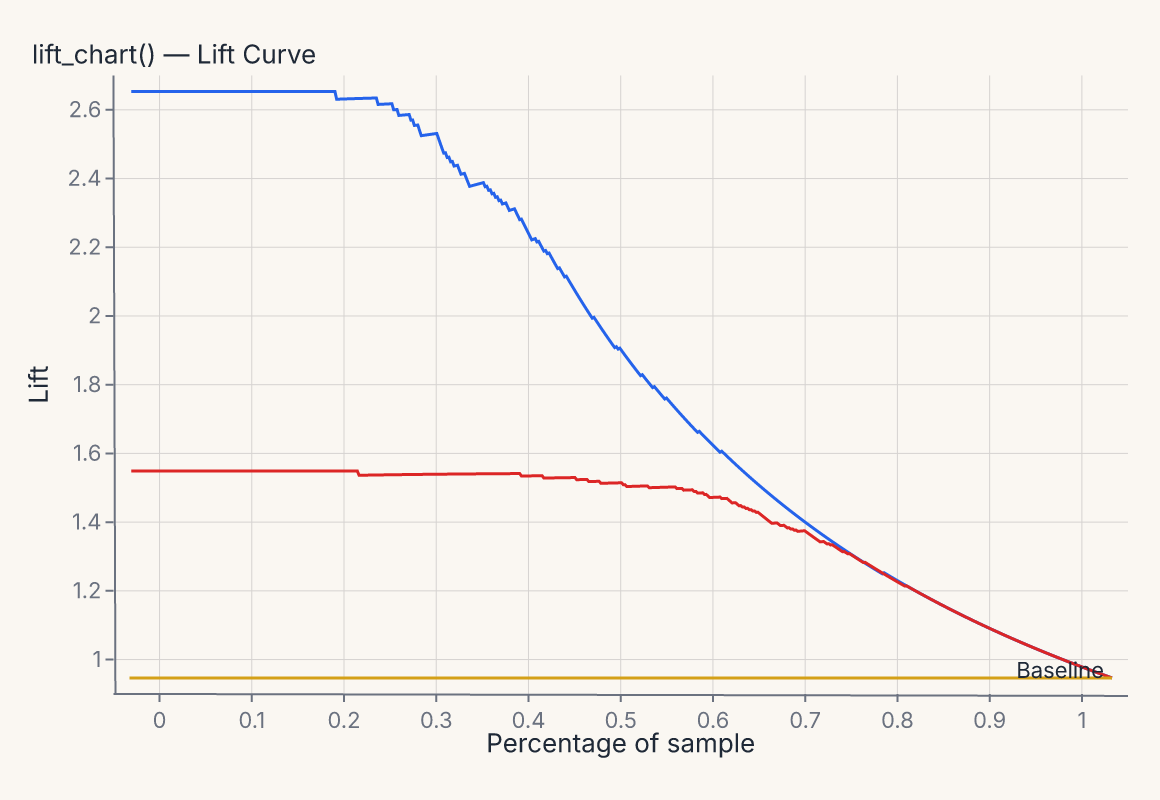
fm.lift_chart(model, X_test, y_test) -
Feature importance
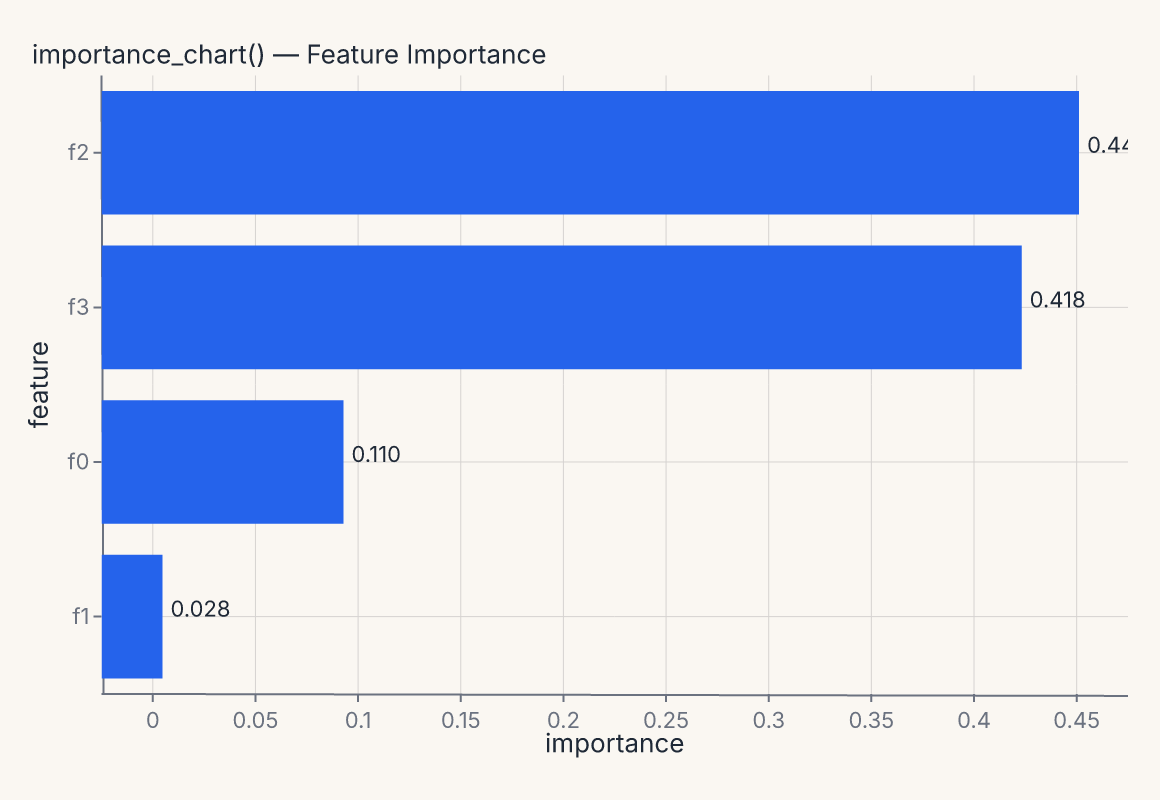
fm.importance_chart(model, X_test, y_test) -
SHAP beeswarm
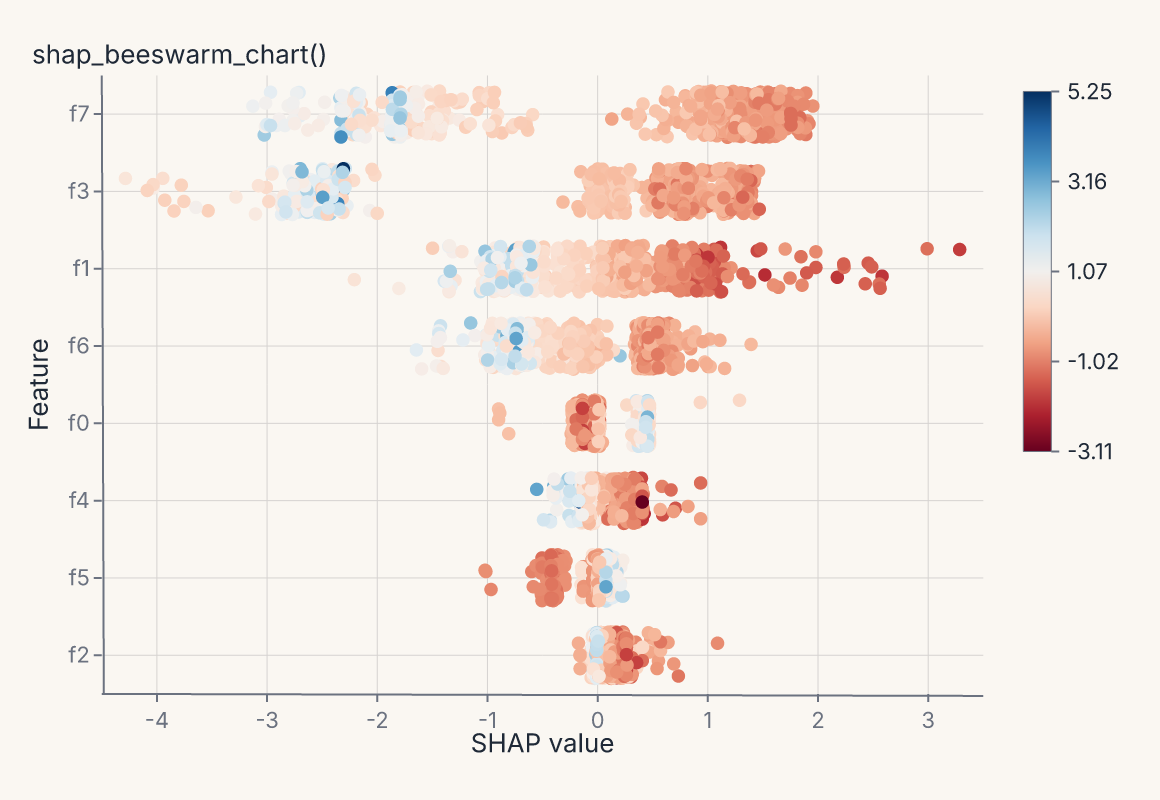
fm.shap_beeswarm_chart(model, X, y) -
SHAP bar
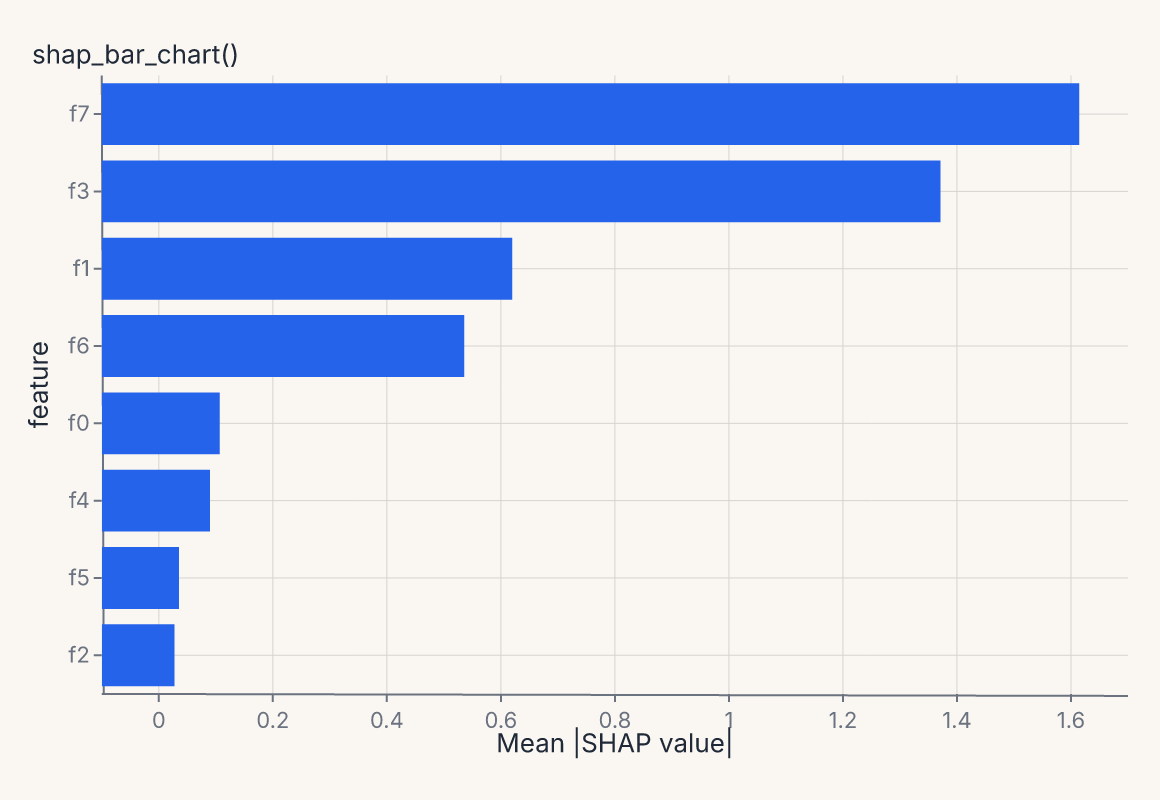
fm.shap_bar_chart(model, X, y) -
Partial dependence
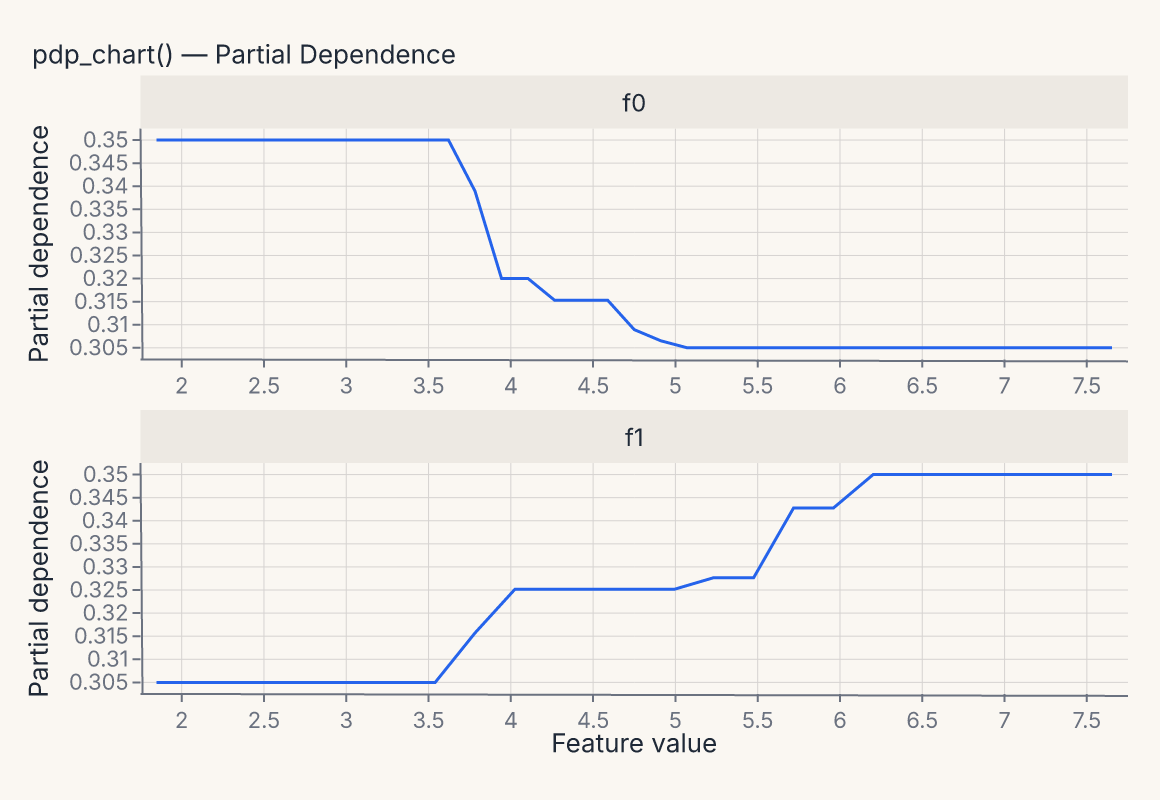
fm.pdp_chart(model, X, y, features=[0, 1]) -
Residuals
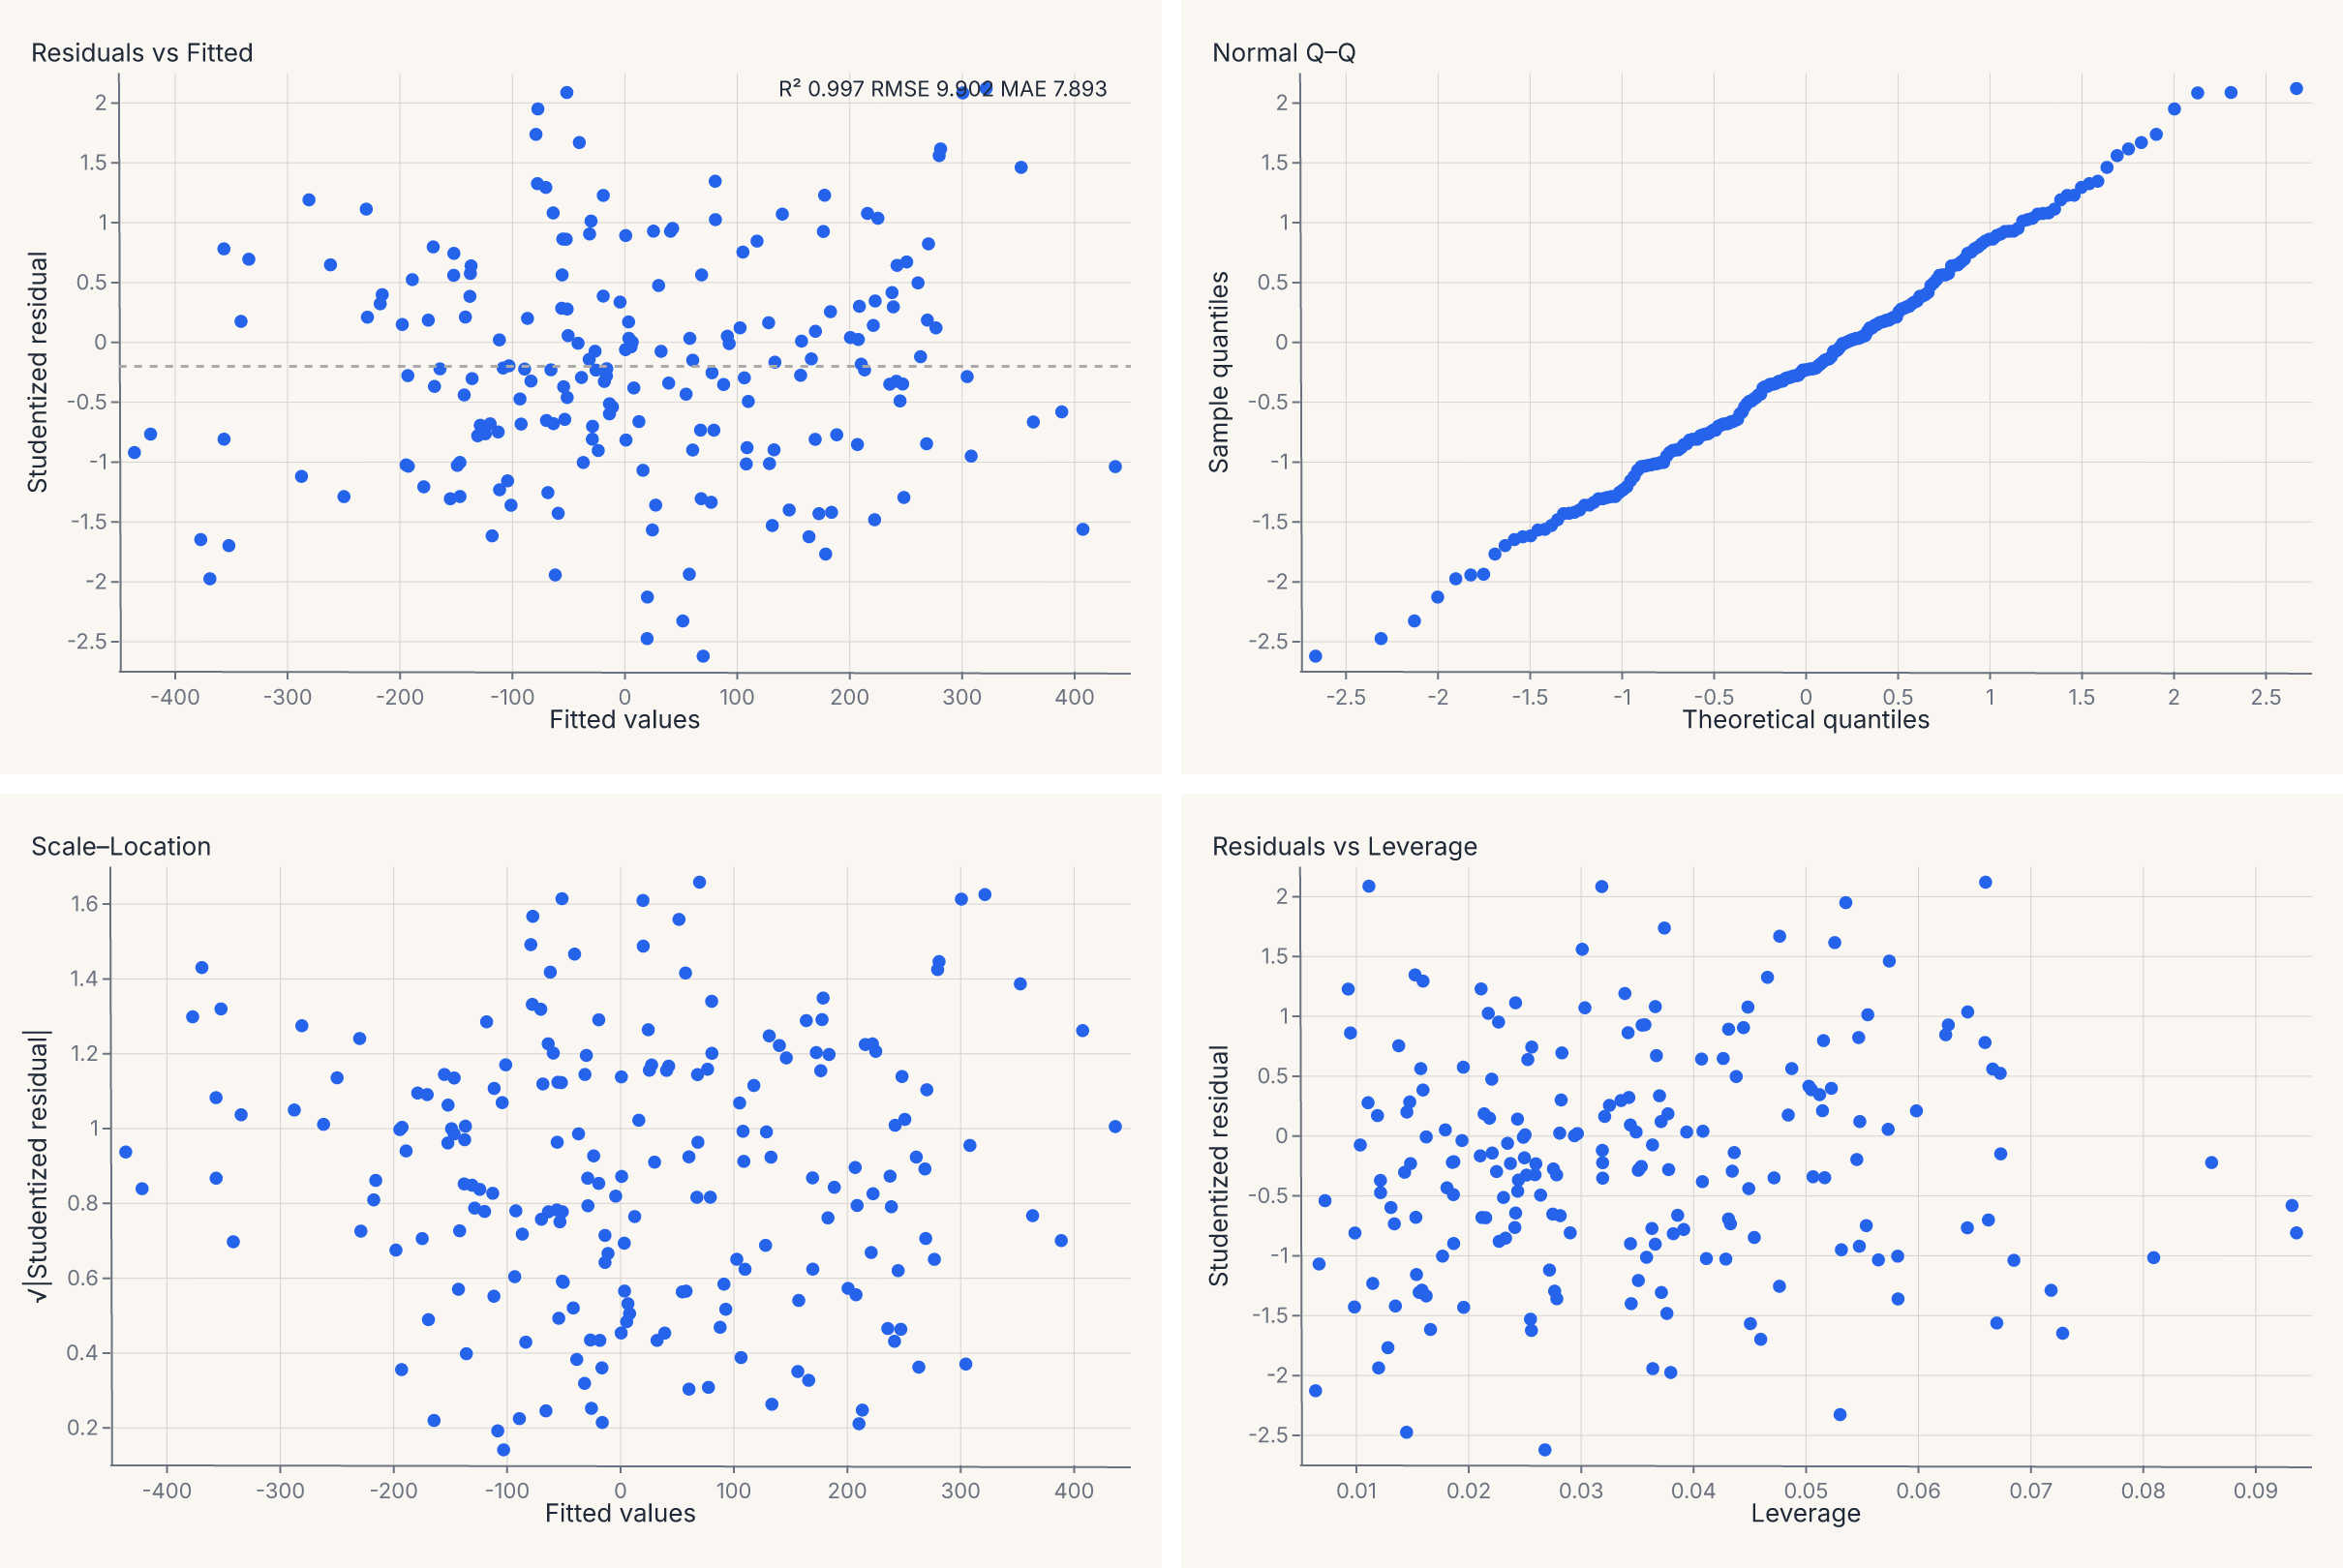
fm.residuals_chart(model, X, y) -
Prediction error
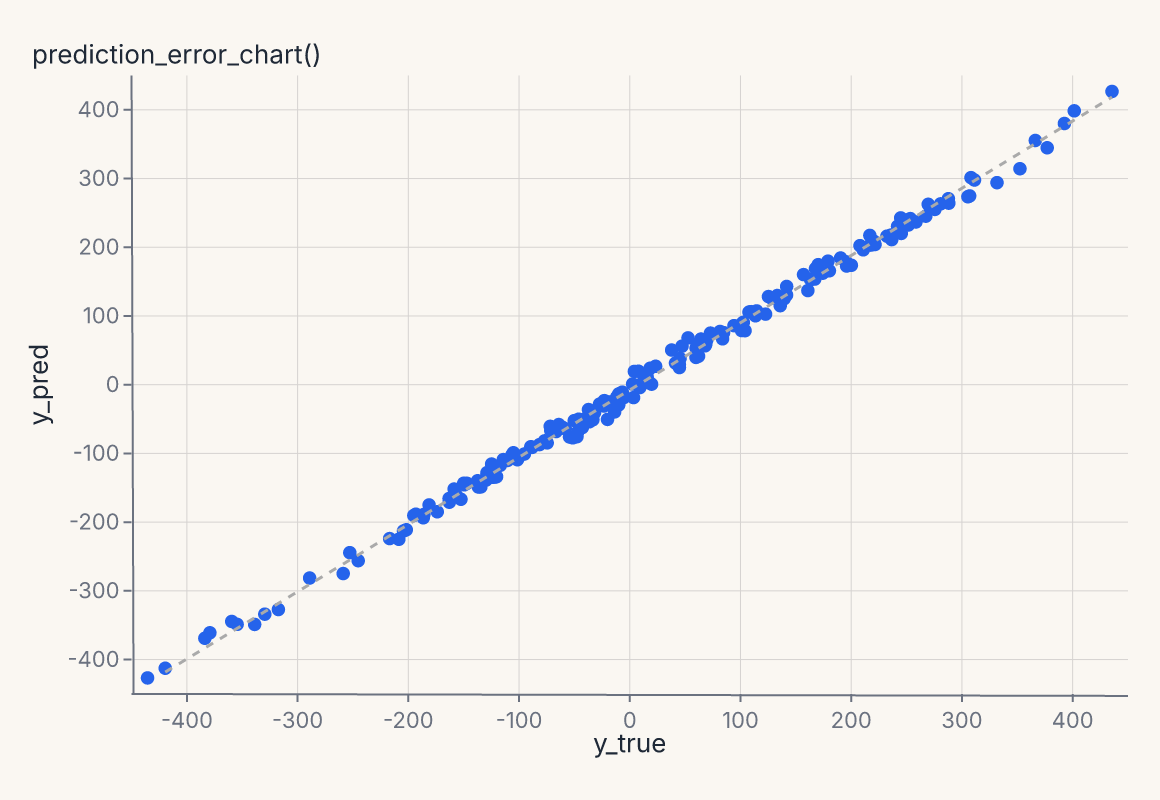
fm.Chart(source.predictions()).mark_prediction_error() -
Learning curve
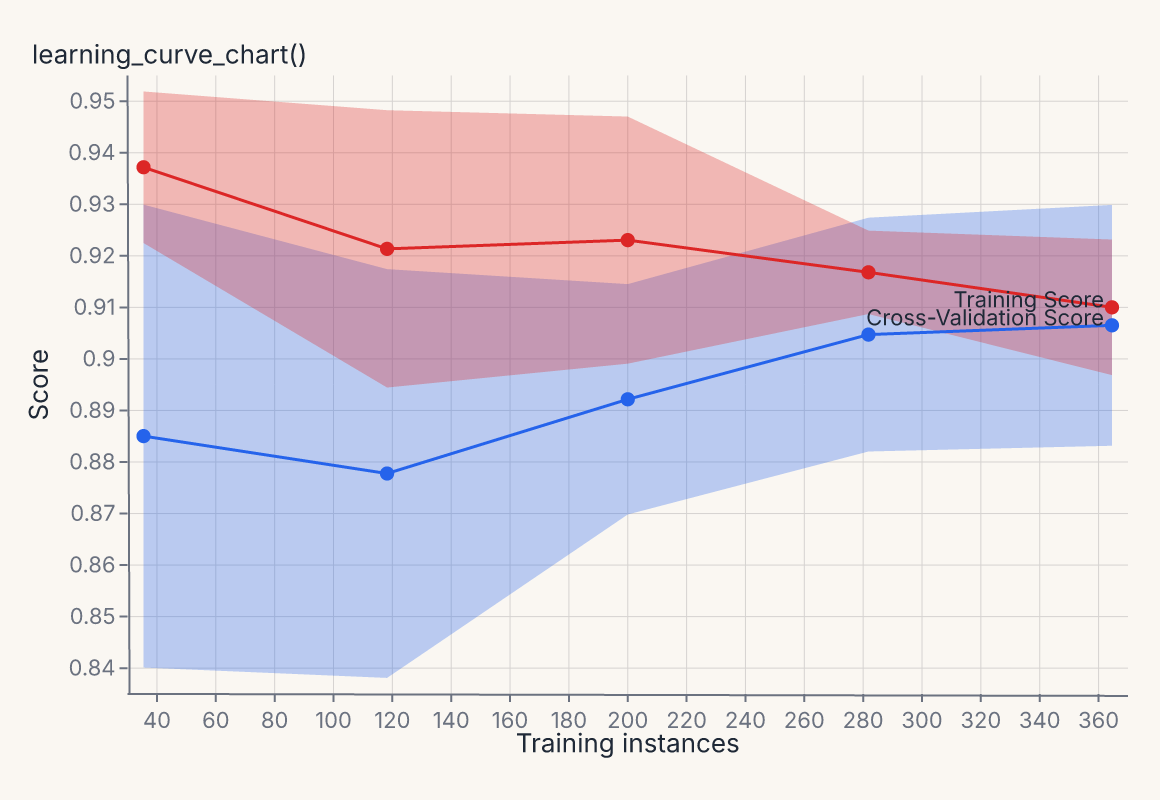
fm.learning_curve_chart(model, X, y, cv=3) -
Validation curve
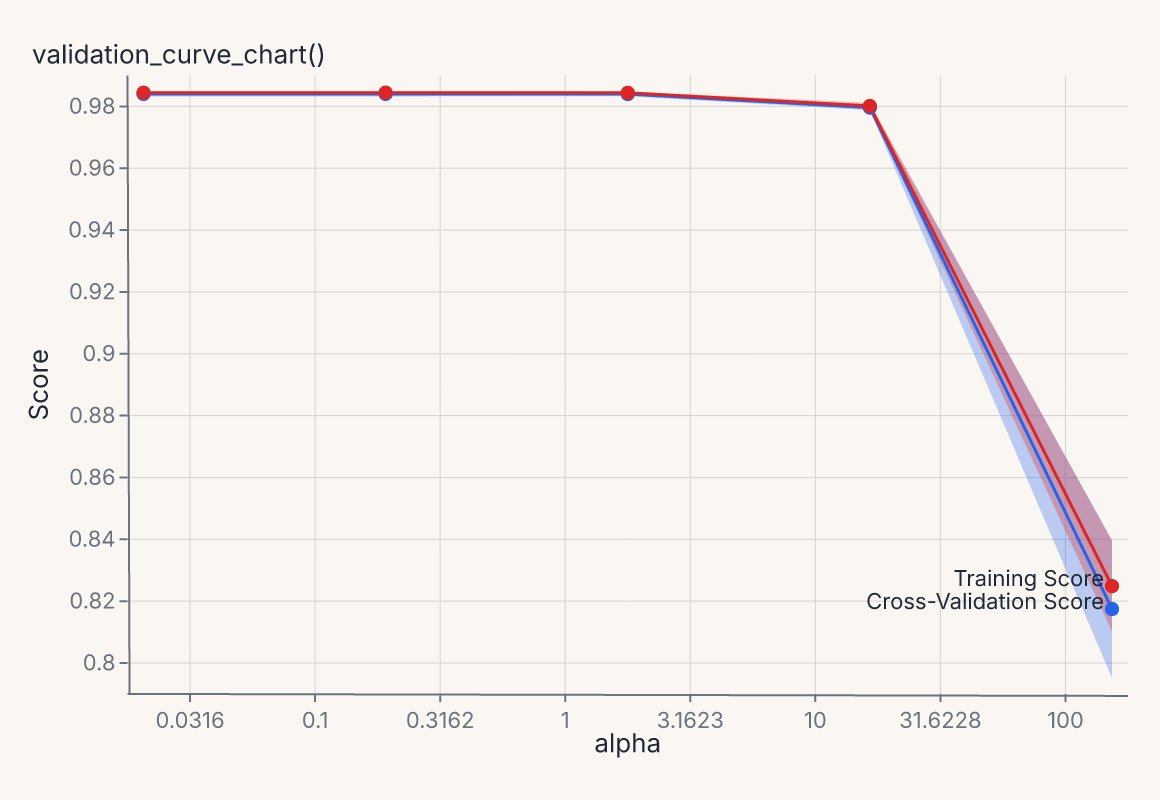
fm.validation_curve_chart(Ridge(), X, y, param="alpha", values=[...]) -
CV scores
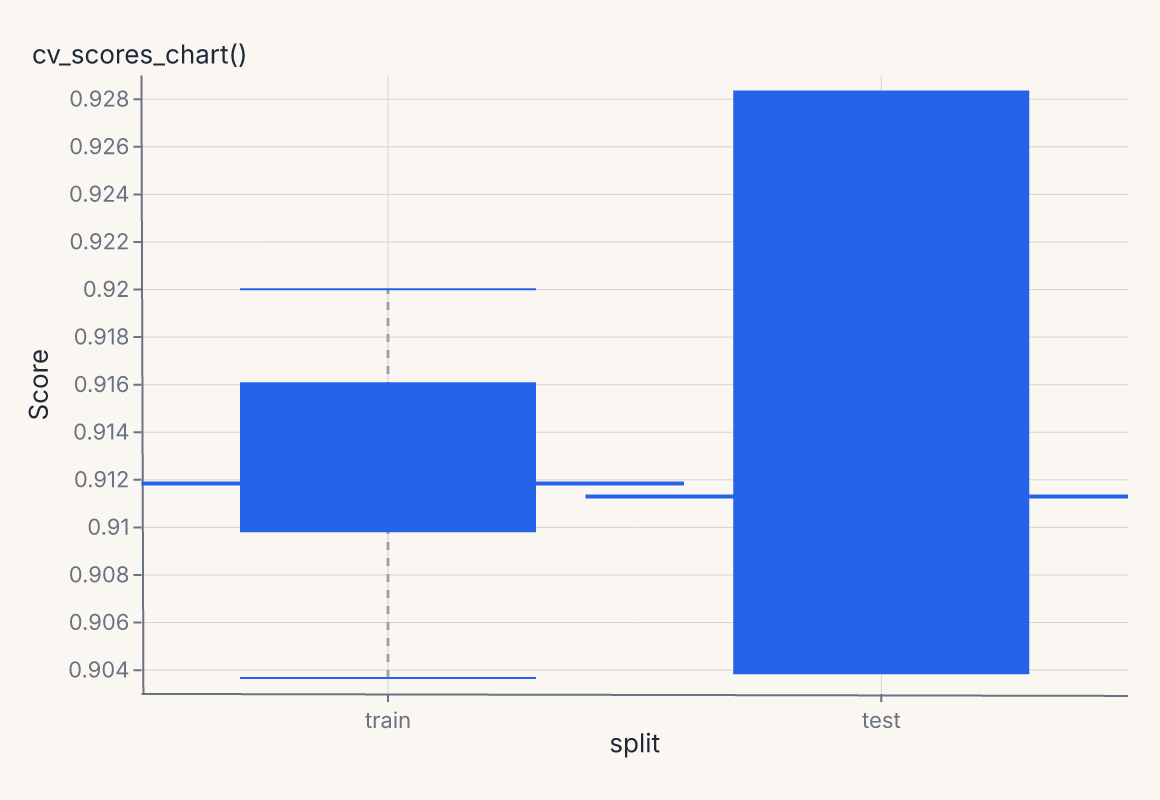
fm.cv_scores_chart(model, X, y, cv=5) -
Calibration
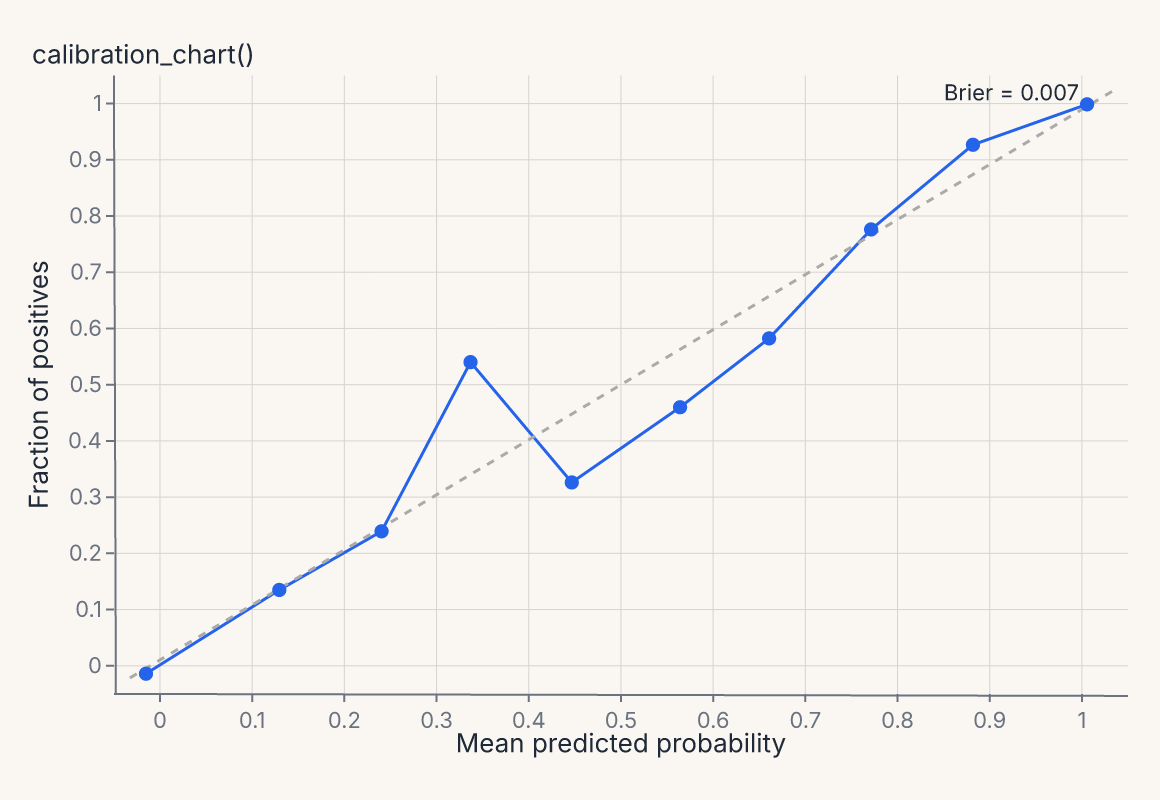
fm.calibration_chart(model, X, y) -
Alpha selection
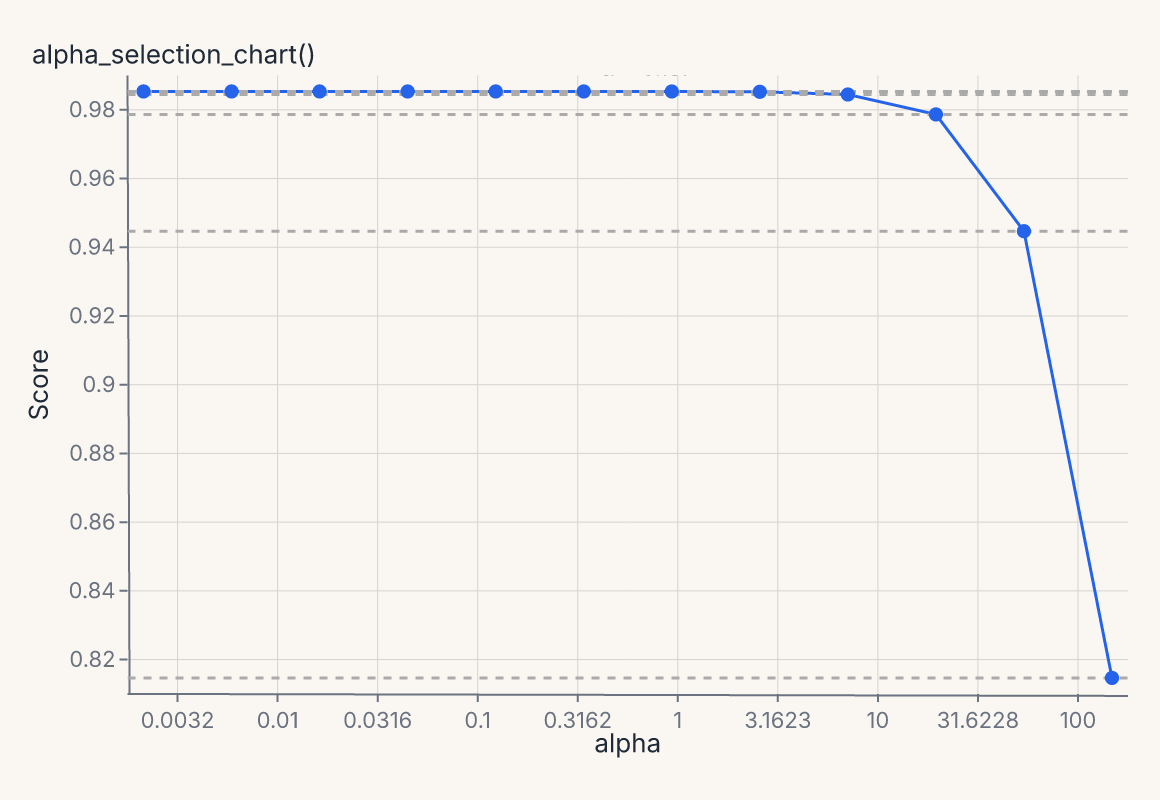
fm.alpha_selection_chart(Ridge(), X, y, alphas=[...]) -
Decision boundary
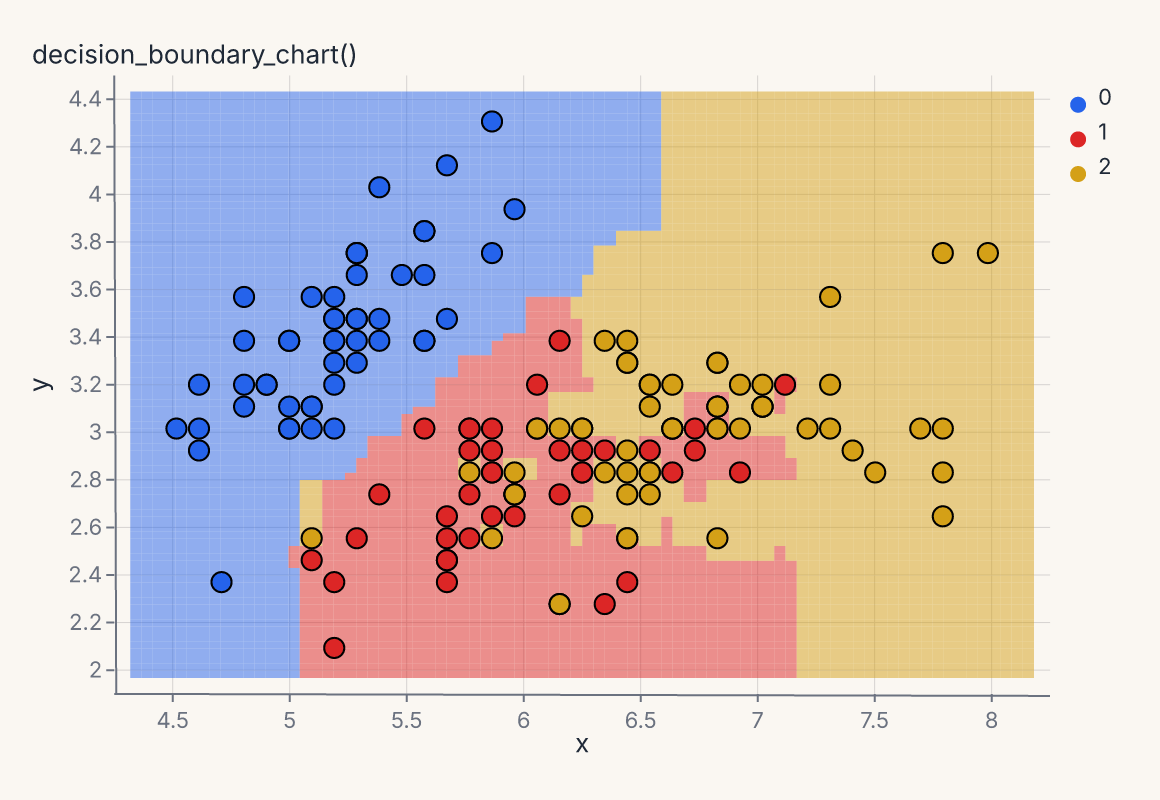
fm.decision_boundary_chart(model, X, y, features=(0, 1)) -
Silhouette / cluster diagnostics
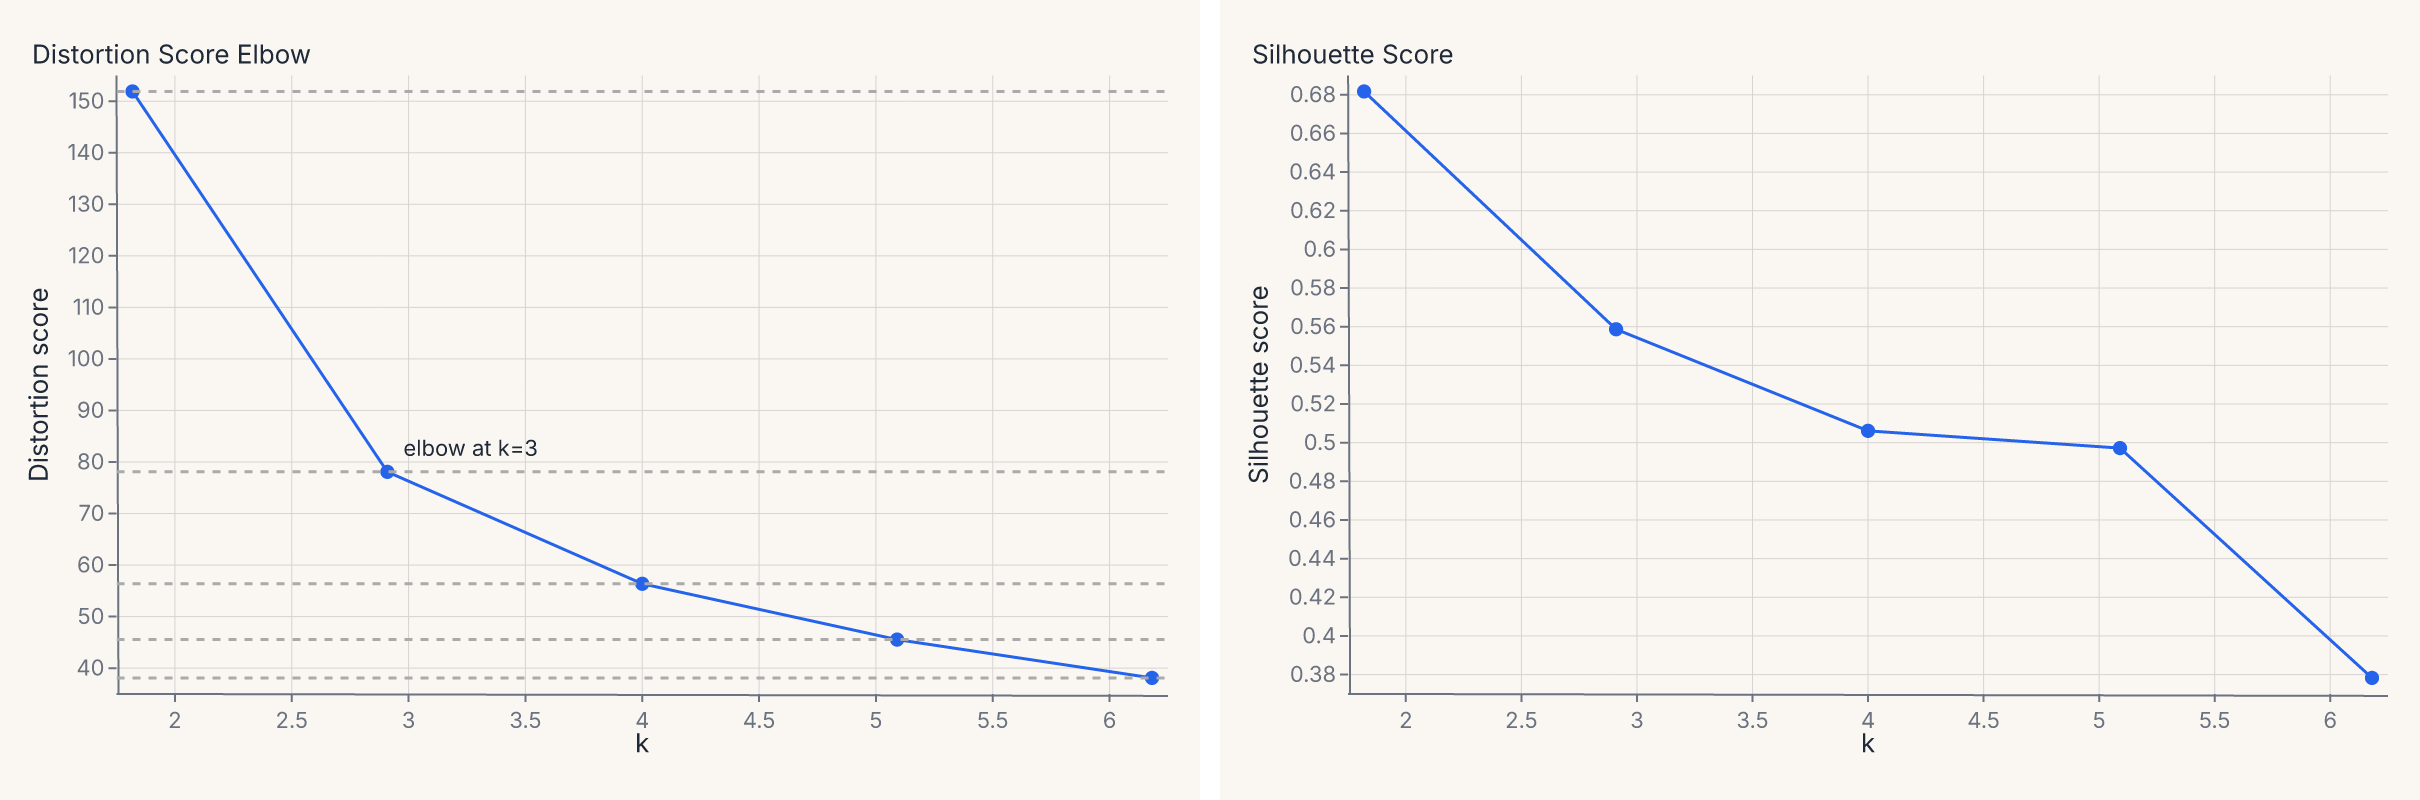
fm.cluster_diagnostics(X, ks=range(2, 7)) -
Intercluster distance
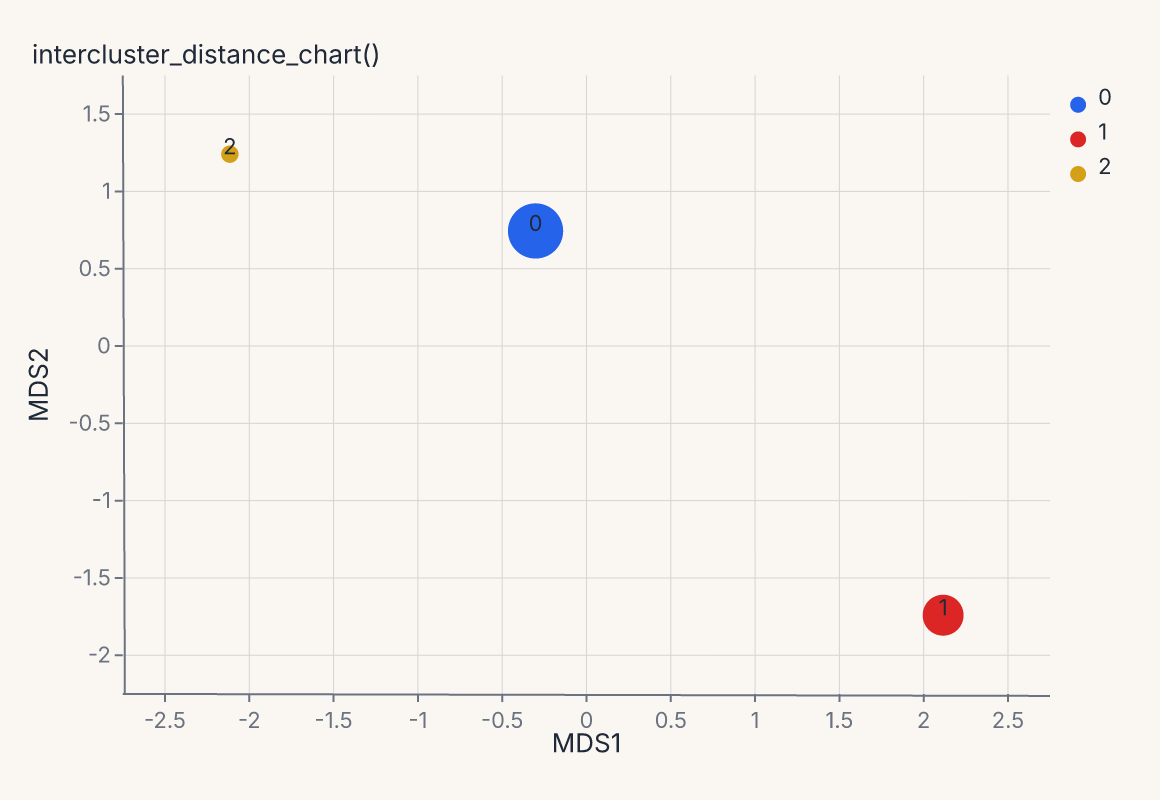
fm.intercluster_distance_chart(km, X) -
PCA scree
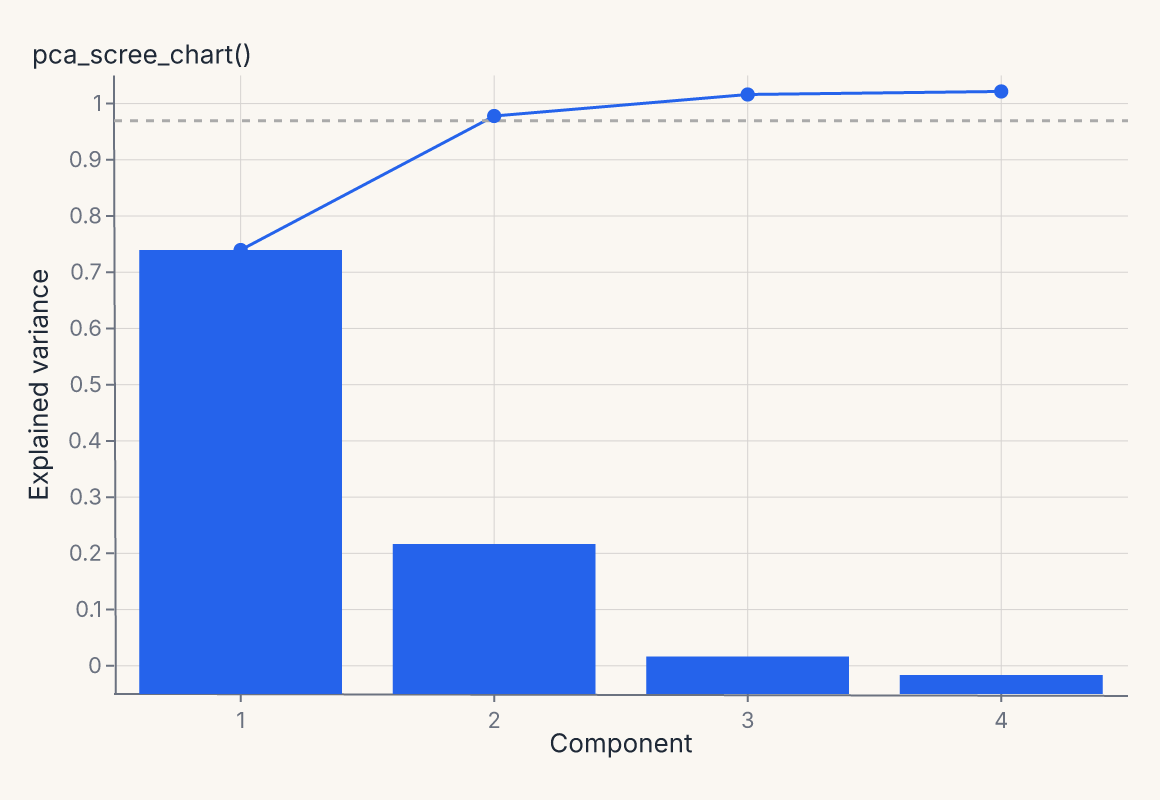
fm.pca_scree_chart(pca, X)
Ferrum theme identities
Three original theme identities ship with Ferrum. Each pairs a background, typography, mark palette, and color schemes into a cohesive look.
Paper Ink (default)
Warm cream background, blue lead marks, perceptually balanced categorical cycle.
Slate Citrus
Dark navy background, vibrant neon accents, lime/cyan categorical cycle.
Arctic Signal
Cool white background, sky blue lead mark, precise signal palette.
See the full Themes guide for the complete list of twelve built-in themes and how to build your own.